Moroccan vs Immigrants from Australia Unemployment Among Ages 45 to 54 years
COMPARE
Moroccan
Immigrants from Australia
Unemployment Among Ages 45 to 54 years
Unemployment Among Ages 45 to 54 years Comparison
Moroccans
Immigrants from Australia
4.8%
UNEMPLOYMENT AMONG AGES 45 TO 54 YEARS
0.3/ 100
METRIC RATING
253rd/ 347
METRIC RANK
4.5%
UNEMPLOYMENT AMONG AGES 45 TO 54 YEARS
48.5/ 100
METRIC RATING
178th/ 347
METRIC RANK
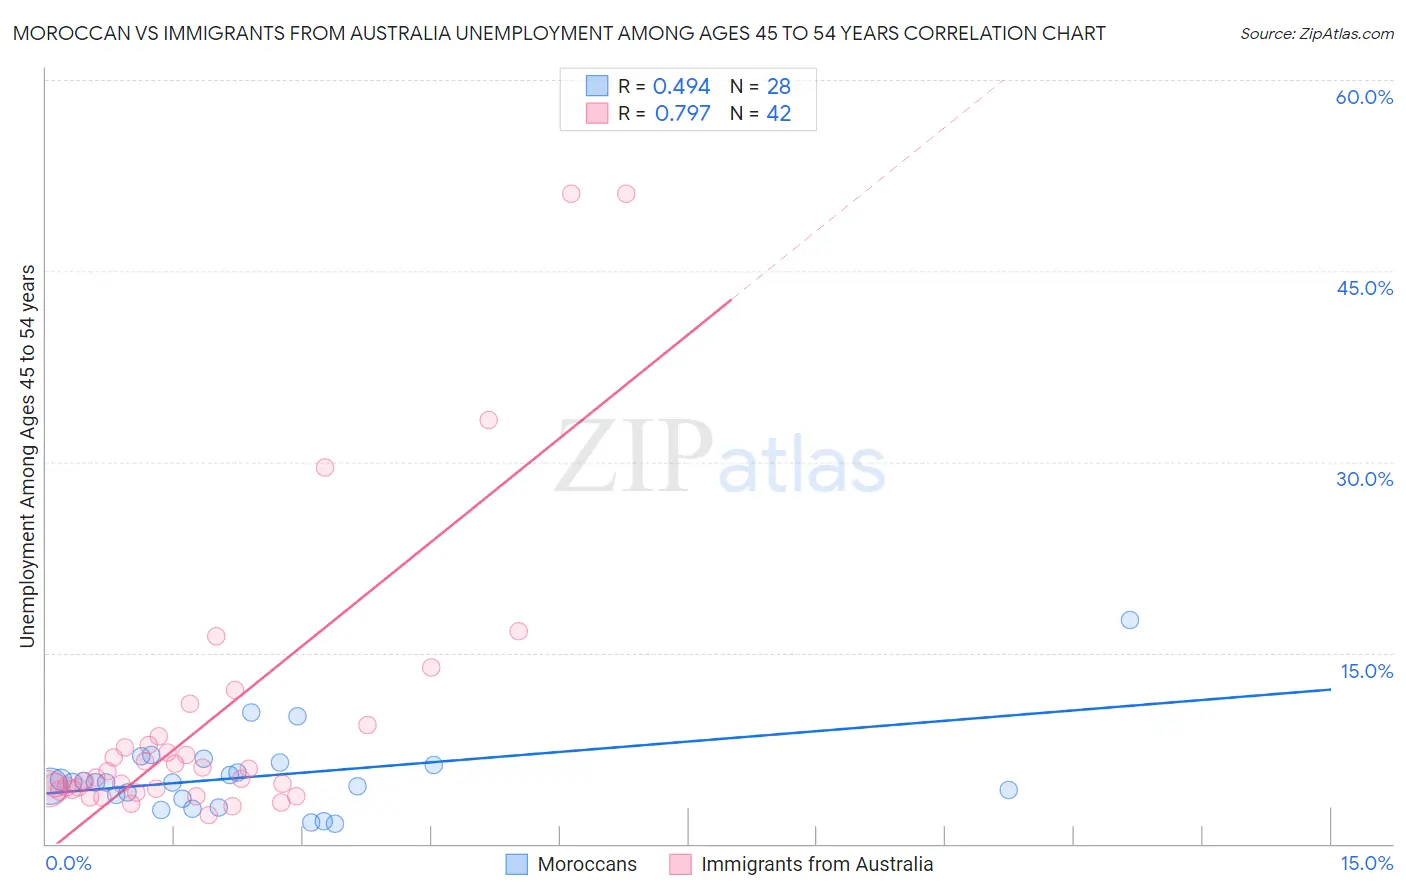
Moroccan vs Immigrants from Australia Unemployment Among Ages 45 to 54 years Correlation Chart
The statistical analysis conducted on geographies consisting of 199,854,001 people shows a moderate positive correlation between the proportion of Moroccans and unemployment rate among population between the ages 45 and 54 in the United States with a correlation coefficient (R) of 0.494 and weighted average of 4.8%. Similarly, the statistical analysis conducted on geographies consisting of 223,893,284 people shows a strong positive correlation between the proportion of Immigrants from Australia and unemployment rate among population between the ages 45 and 54 in the United States with a correlation coefficient (R) of 0.797 and weighted average of 4.5%, a difference of 6.7%.
Unemployment Among Ages 45 to 54 years Correlation Summary
| Measurement | Moroccan | Immigrants from Australia |
| Minimum | 1.6% | 2.2% |
| Maximum | 17.6% | 51.1% |
| Range | 16.0% | 48.9% |
| Mean | 5.3% | 9.6% |
| Median | 4.8% | 5.4% |
| Interquartile 25% (IQ1) | 3.7% | 4.3% |
| Interquartile 75% (IQ3) | 6.3% | 8.5% |
| Interquartile Range (IQR) | 2.6% | 4.2% |
| Standard Deviation (Sample) | 3.2% | 11.3% |
| Standard Deviation (Population) | 3.1% | 11.2% |
Similar Demographics by Unemployment Among Ages 45 to 54 years
Demographics Similar to Moroccans by Unemployment Among Ages 45 to 54 years
In terms of unemployment among ages 45 to 54 years, the demographic groups most similar to Moroccans are Immigrants from Bahamas (4.8%, a difference of 0.17%), Immigrants from Lebanon (4.8%, a difference of 0.22%), Immigrants from El Salvador (4.8%, a difference of 0.35%), Honduran (4.8%, a difference of 0.41%), and Immigrants from Western Asia (4.8%, a difference of 0.43%).
| Demographics | Rating | Rank | Unemployment Among Ages 45 to 54 years |
| Immigrants | Syria | 0.9 /100 | #246 | Tragic 4.8% |
| Israelis | 0.9 /100 | #247 | Tragic 4.8% |
| Immigrants | Liberia | 0.8 /100 | #248 | Tragic 4.8% |
| Immigrants | Honduras | 0.7 /100 | #249 | Tragic 4.8% |
| Salvadorans | 0.7 /100 | #250 | Tragic 4.8% |
| Hondurans | 0.4 /100 | #251 | Tragic 4.8% |
| Immigrants | Bahamas | 0.3 /100 | #252 | Tragic 4.8% |
| Moroccans | 0.3 /100 | #253 | Tragic 4.8% |
| Immigrants | Lebanon | 0.2 /100 | #254 | Tragic 4.8% |
| Immigrants | El Salvador | 0.2 /100 | #255 | Tragic 4.8% |
| Immigrants | Western Asia | 0.2 /100 | #256 | Tragic 4.8% |
| Immigrants | Western Africa | 0.2 /100 | #257 | Tragic 4.9% |
| Sub-Saharan Africans | 0.2 /100 | #258 | Tragic 4.9% |
| Ugandans | 0.1 /100 | #259 | Tragic 4.9% |
| Mexican American Indians | 0.1 /100 | #260 | Tragic 4.9% |
Demographics Similar to Immigrants from Australia by Unemployment Among Ages 45 to 54 years
In terms of unemployment among ages 45 to 54 years, the demographic groups most similar to Immigrants from Australia are Immigrants from Russia (4.5%, a difference of 0.010%), Immigrants from Northern Africa (4.5%, a difference of 0.020%), Puget Sound Salish (4.5%, a difference of 0.030%), Immigrants from France (4.5%, a difference of 0.040%), and Malaysian (4.5%, a difference of 0.050%).
| Demographics | Rating | Rank | Unemployment Among Ages 45 to 54 years |
| Egyptians | 53.6 /100 | #171 | Average 4.5% |
| Colombians | 53.3 /100 | #172 | Average 4.5% |
| Immigrants | Colombia | 52.0 /100 | #173 | Average 4.5% |
| Immigrants | Hungary | 50.0 /100 | #174 | Average 4.5% |
| Immigrants | France | 49.4 /100 | #175 | Average 4.5% |
| Puget Sound Salish | 49.1 /100 | #176 | Average 4.5% |
| Immigrants | Northern Africa | 49.0 /100 | #177 | Average 4.5% |
| Immigrants | Australia | 48.5 /100 | #178 | Average 4.5% |
| Immigrants | Russia | 48.2 /100 | #179 | Average 4.5% |
| Malaysians | 47.5 /100 | #180 | Average 4.5% |
| Immigrants | Poland | 47.0 /100 | #181 | Average 4.5% |
| Immigrants | China | 46.7 /100 | #182 | Average 4.5% |
| Sierra Leoneans | 46.7 /100 | #183 | Average 4.5% |
| Immigrants | Hong Kong | 45.9 /100 | #184 | Average 4.5% |
| Immigrants | Philippines | 41.0 /100 | #185 | Average 4.5% |