Moroccan vs Immigrants from Venezuela Single Father Households
COMPARE
Moroccan
Immigrants from Venezuela
Single Father Households
Single Father Households Comparison
Moroccans
Immigrants from Venezuela
2.2%
SINGLE FATHER HOUSEHOLDS
96.9/ 100
METRIC RATING
126th/ 347
METRIC RANK
2.3%
SINGLE FATHER HOUSEHOLDS
83.2/ 100
METRIC RATING
152nd/ 347
METRIC RANK
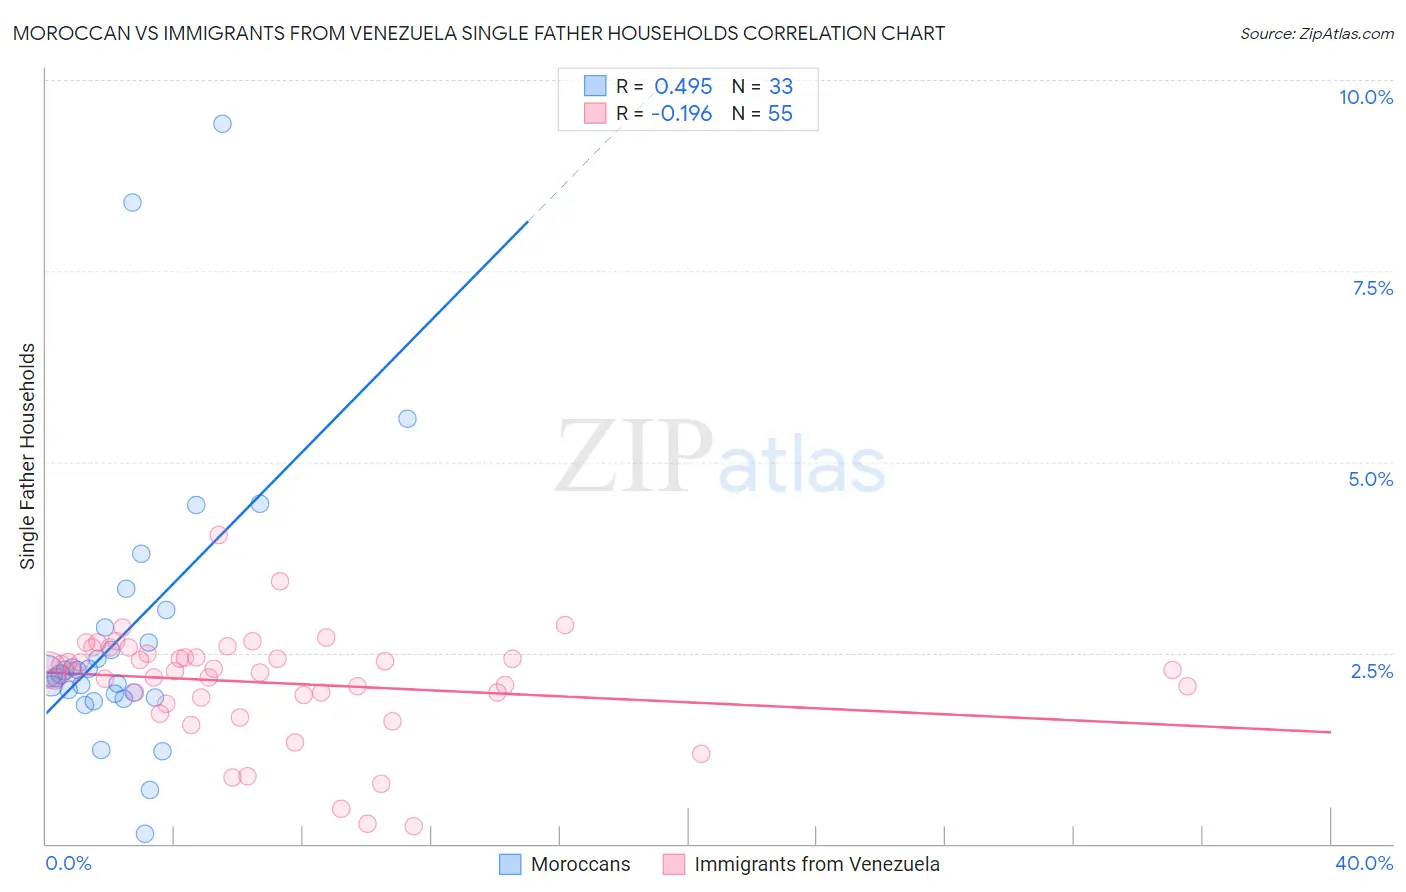
Moroccan vs Immigrants from Venezuela Single Father Households Correlation Chart
The statistical analysis conducted on geographies consisting of 201,125,863 people shows a moderate positive correlation between the proportion of Moroccans and percentage of single father households in the United States with a correlation coefficient (R) of 0.495 and weighted average of 2.2%. Similarly, the statistical analysis conducted on geographies consisting of 286,595,714 people shows a poor negative correlation between the proportion of Immigrants from Venezuela and percentage of single father households in the United States with a correlation coefficient (R) of -0.196 and weighted average of 2.3%, a difference of 3.6%.
Single Father Households Correlation Summary
| Measurement | Moroccan | Immigrants from Venezuela |
| Minimum | 0.13% | 0.23% |
| Maximum | 9.4% | 4.1% |
| Range | 9.3% | 3.8% |
| Mean | 2.8% | 2.1% |
| Median | 2.3% | 2.3% |
| Interquartile 25% (IQ1) | 1.9% | 1.9% |
| Interquartile 75% (IQ3) | 2.9% | 2.5% |
| Interquartile Range (IQR) | 1.0% | 0.58% |
| Standard Deviation (Sample) | 1.9% | 0.71% |
| Standard Deviation (Population) | 1.9% | 0.70% |
Similar Demographics by Single Father Households
Demographics Similar to Moroccans by Single Father Households
In terms of single father households, the demographic groups most similar to Moroccans are Jordanian (2.2%, a difference of 0.0%), Immigrants from England (2.2%, a difference of 0.050%), Serbian (2.2%, a difference of 0.060%), Immigrants from Chile (2.2%, a difference of 0.17%), and Immigrants from Jordan (2.2%, a difference of 0.23%).
| Demographics | Rating | Rank | Single Father Households |
| Trinidadians and Tobagonians | 97.8 /100 | #119 | Exceptional 2.2% |
| Australians | 97.7 /100 | #120 | Exceptional 2.2% |
| Immigrants | Brazil | 97.7 /100 | #121 | Exceptional 2.2% |
| Immigrants | Iraq | 97.6 /100 | #122 | Exceptional 2.2% |
| Immigrants | Yemen | 97.5 /100 | #123 | Exceptional 2.2% |
| British West Indians | 97.4 /100 | #124 | Exceptional 2.2% |
| Immigrants | Indonesia | 97.4 /100 | #125 | Exceptional 2.2% |
| Moroccans | 96.9 /100 | #126 | Exceptional 2.2% |
| Jordanians | 96.9 /100 | #127 | Exceptional 2.2% |
| Immigrants | England | 96.8 /100 | #128 | Exceptional 2.2% |
| Serbians | 96.8 /100 | #129 | Exceptional 2.2% |
| Immigrants | Chile | 96.7 /100 | #130 | Exceptional 2.2% |
| Immigrants | Jordan | 96.6 /100 | #131 | Exceptional 2.2% |
| Poles | 96.5 /100 | #132 | Exceptional 2.2% |
| Taiwanese | 96.3 /100 | #133 | Exceptional 2.2% |
Demographics Similar to Immigrants from Venezuela by Single Father Households
In terms of single father households, the demographic groups most similar to Immigrants from Venezuela are Immigrants from Germany (2.3%, a difference of 0.050%), Immigrants from Syria (2.3%, a difference of 0.23%), Bolivian (2.3%, a difference of 0.28%), European (2.3%, a difference of 0.29%), and Immigrants from South America (2.3%, a difference of 0.41%).
| Demographics | Rating | Rank | Single Father Households |
| Immigrants | Zimbabwe | 90.2 /100 | #145 | Exceptional 2.2% |
| Northern Europeans | 89.8 /100 | #146 | Excellent 2.2% |
| Slavs | 88.9 /100 | #147 | Excellent 2.2% |
| South American Indians | 88.5 /100 | #148 | Excellent 2.3% |
| Senegalese | 88.4 /100 | #149 | Excellent 2.3% |
| Venezuelans | 86.2 /100 | #150 | Excellent 2.3% |
| Immigrants | Syria | 84.8 /100 | #151 | Excellent 2.3% |
| Immigrants | Venezuela | 83.2 /100 | #152 | Excellent 2.3% |
| Immigrants | Germany | 82.8 /100 | #153 | Excellent 2.3% |
| Bolivians | 81.0 /100 | #154 | Excellent 2.3% |
| Europeans | 80.9 /100 | #155 | Excellent 2.3% |
| Immigrants | South America | 79.9 /100 | #156 | Good 2.3% |
| Canadians | 79.7 /100 | #157 | Good 2.3% |
| Immigrants | Senegal | 79.4 /100 | #158 | Good 2.3% |
| Immigrants | West Indies | 77.9 /100 | #159 | Good 2.3% |