Immigrants from Senegal vs German Divorced or Separated
COMPARE
Immigrants from Senegal
German
Divorced or Separated
Divorced or Separated Comparison
Immigrants from Senegal
Germans
12.6%
DIVORCED OR SEPARATED
0.5/ 100
METRIC RATING
265th/ 347
METRIC RANK
12.5%
DIVORCED OR SEPARATED
1.8/ 100
METRIC RATING
247th/ 347
METRIC RANK
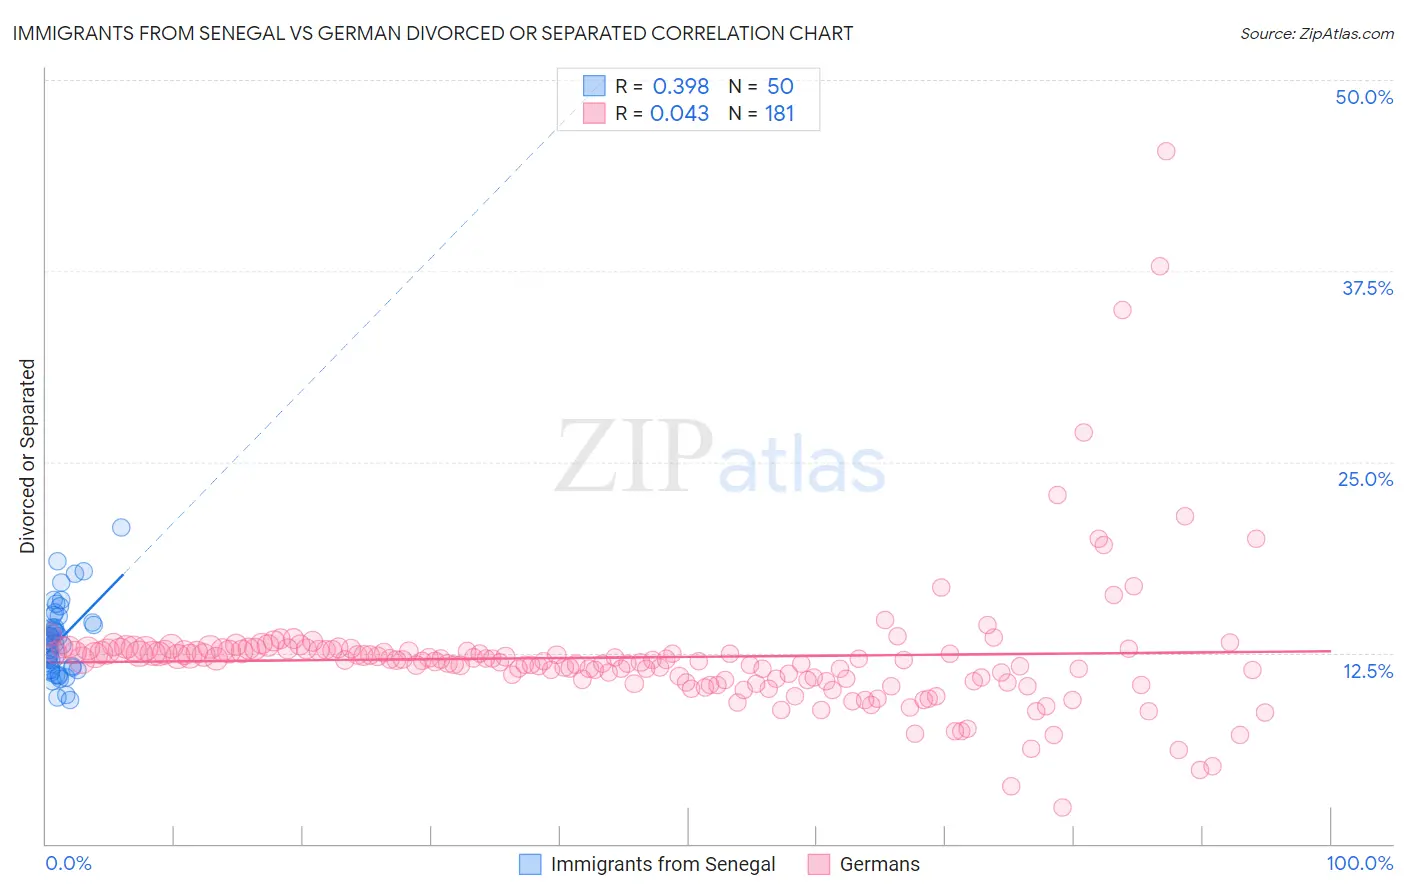
Immigrants from Senegal vs German Divorced or Separated Correlation Chart
The statistical analysis conducted on geographies consisting of 90,108,226 people shows a mild positive correlation between the proportion of Immigrants from Senegal and percentage of population currently divorced or separated in the United States with a correlation coefficient (R) of 0.398 and weighted average of 12.6%. Similarly, the statistical analysis conducted on geographies consisting of 580,609,832 people shows no correlation between the proportion of Germans and percentage of population currently divorced or separated in the United States with a correlation coefficient (R) of 0.043 and weighted average of 12.5%, a difference of 1.2%.
Divorced or Separated Correlation Summary
| Measurement | Immigrants from Senegal | German |
| Minimum | 9.4% | 2.4% |
| Maximum | 20.7% | 45.3% |
| Range | 11.3% | 42.9% |
| Mean | 13.4% | 12.2% |
| Median | 13.2% | 12.0% |
| Interquartile 25% (IQ1) | 11.5% | 10.7% |
| Interquartile 75% (IQ3) | 14.5% | 12.7% |
| Interquartile Range (IQR) | 3.0% | 2.0% |
| Standard Deviation (Sample) | 2.4% | 4.5% |
| Standard Deviation (Population) | 2.4% | 4.5% |
Demographics Similar to Immigrants from Senegal and Germans by Divorced or Separated
In terms of divorced or separated, the demographic groups most similar to Immigrants from Senegal are White/Caucasian (12.6%, a difference of 0.010%), English (12.6%, a difference of 0.020%), Immigrants from Panama (12.6%, a difference of 0.030%), Basque (12.6%, a difference of 0.090%), and Immigrants from Dominica (12.6%, a difference of 0.15%). Similarly, the demographic groups most similar to Germans are Nepalese (12.5%, a difference of 0.020%), Immigrants from West Indies (12.5%, a difference of 0.030%), Finnish (12.5%, a difference of 0.040%), Irish (12.5%, a difference of 0.31%), and Aleut (12.5%, a difference of 0.31%).
| Demographics | Rating | Rank | Divorced or Separated |
| Immigrants | West Indies | 1.9 /100 | #246 | Tragic 12.5% |
| Germans | 1.8 /100 | #247 | Tragic 12.5% |
| Nepalese | 1.8 /100 | #248 | Tragic 12.5% |
| Finns | 1.8 /100 | #249 | Tragic 12.5% |
| Irish | 1.3 /100 | #250 | Tragic 12.5% |
| Aleuts | 1.3 /100 | #251 | Tragic 12.5% |
| Liberians | 0.9 /100 | #252 | Tragic 12.6% |
| Somalis | 0.9 /100 | #253 | Tragic 12.6% |
| Senegalese | 0.8 /100 | #254 | Tragic 12.6% |
| Welsh | 0.7 /100 | #255 | Tragic 12.6% |
| Immigrants | Colombia | 0.6 /100 | #256 | Tragic 12.6% |
| Immigrants | Somalia | 0.6 /100 | #257 | Tragic 12.6% |
| Indonesians | 0.6 /100 | #258 | Tragic 12.6% |
| Yuman | 0.6 /100 | #259 | Tragic 12.6% |
| Immigrants | Uruguay | 0.6 /100 | #260 | Tragic 12.6% |
| Immigrants | Dominica | 0.5 /100 | #261 | Tragic 12.6% |
| Basques | 0.5 /100 | #262 | Tragic 12.6% |
| Immigrants | Panama | 0.5 /100 | #263 | Tragic 12.6% |
| English | 0.5 /100 | #264 | Tragic 12.6% |
| Immigrants | Senegal | 0.5 /100 | #265 | Tragic 12.6% |
| Whites/Caucasians | 0.5 /100 | #266 | Tragic 12.6% |