Immigrants from Guatemala vs German Divorced or Separated
COMPARE
Immigrants from Guatemala
German
Divorced or Separated
Divorced or Separated Comparison
Immigrants from Guatemala
Germans
12.2%
DIVORCED OR SEPARATED
23.2/ 100
METRIC RATING
203rd/ 347
METRIC RANK
12.5%
DIVORCED OR SEPARATED
1.8/ 100
METRIC RATING
247th/ 347
METRIC RANK
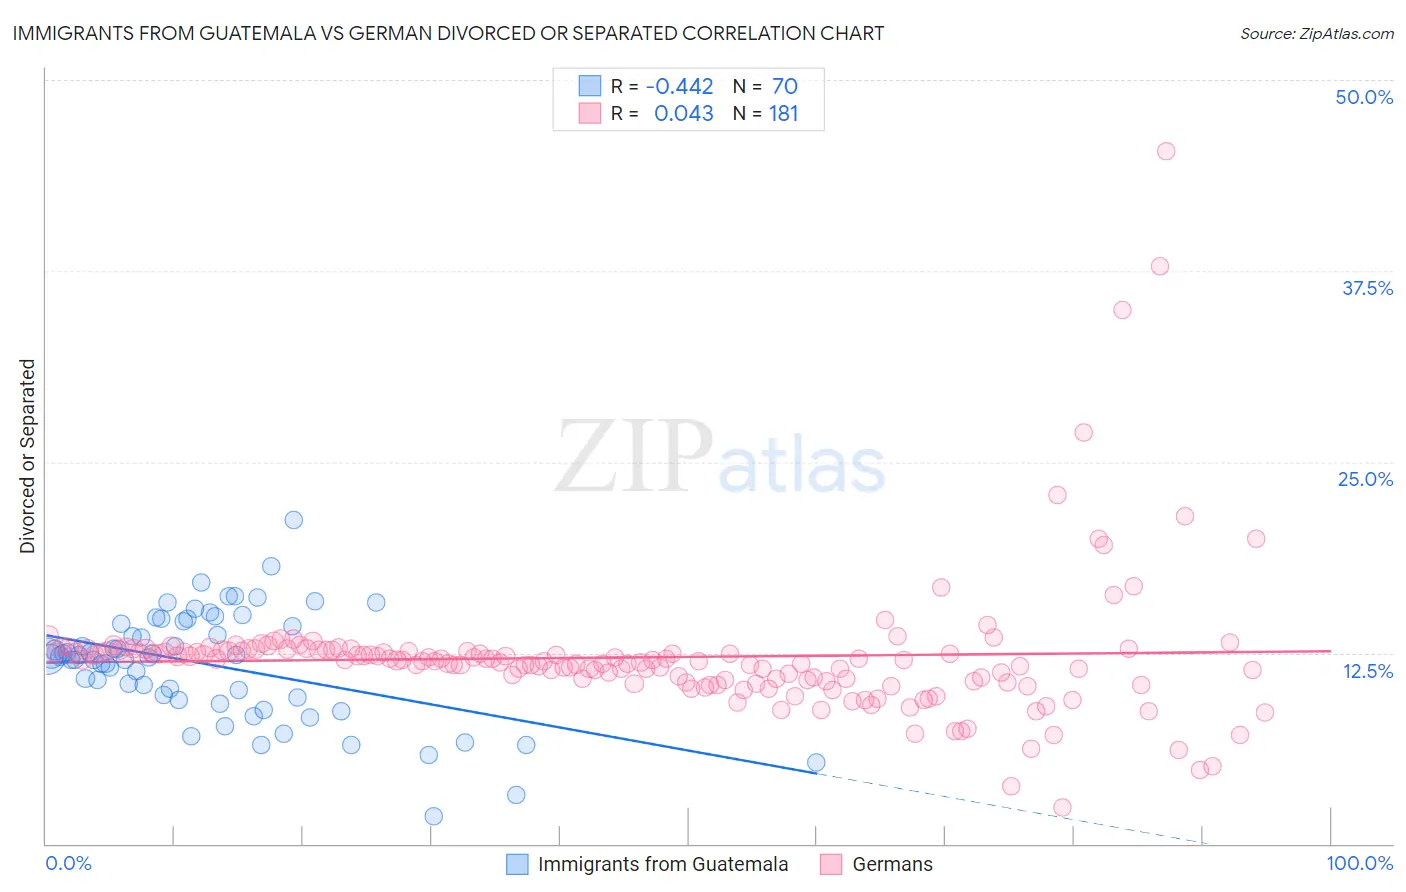
Immigrants from Guatemala vs German Divorced or Separated Correlation Chart
The statistical analysis conducted on geographies consisting of 377,229,357 people shows a moderate negative correlation between the proportion of Immigrants from Guatemala and percentage of population currently divorced or separated in the United States with a correlation coefficient (R) of -0.442 and weighted average of 12.2%. Similarly, the statistical analysis conducted on geographies consisting of 580,609,832 people shows no correlation between the proportion of Germans and percentage of population currently divorced or separated in the United States with a correlation coefficient (R) of 0.043 and weighted average of 12.5%, a difference of 2.4%.
Divorced or Separated Correlation Summary
| Measurement | Immigrants from Guatemala | German |
| Minimum | 1.8% | 2.4% |
| Maximum | 21.2% | 45.3% |
| Range | 19.4% | 42.9% |
| Mean | 11.7% | 12.2% |
| Median | 12.3% | 12.0% |
| Interquartile 25% (IQ1) | 9.6% | 10.7% |
| Interquartile 75% (IQ3) | 14.4% | 12.7% |
| Interquartile Range (IQR) | 4.8% | 2.0% |
| Standard Deviation (Sample) | 3.6% | 4.5% |
| Standard Deviation (Population) | 3.5% | 4.5% |
Similar Demographics by Divorced or Separated
Demographics Similar to Immigrants from Guatemala by Divorced or Separated
In terms of divorced or separated, the demographic groups most similar to Immigrants from Guatemala are Portuguese (12.2%, a difference of 0.020%), Kenyan (12.2%, a difference of 0.070%), Immigrants from Costa Rica (12.2%, a difference of 0.10%), Slovak (12.2%, a difference of 0.11%), and Mexican (12.2%, a difference of 0.11%).
| Demographics | Rating | Rank | Divorced or Separated |
| Immigrants | Burma/Myanmar | 30.4 /100 | #196 | Fair 12.1% |
| Immigrants | Africa | 30.3 /100 | #197 | Fair 12.1% |
| Nigerians | 30.1 /100 | #198 | Fair 12.1% |
| Central Americans | 29.4 /100 | #199 | Fair 12.1% |
| South Americans | 28.6 /100 | #200 | Fair 12.2% |
| Guatemalans | 26.9 /100 | #201 | Fair 12.2% |
| Portuguese | 23.5 /100 | #202 | Fair 12.2% |
| Immigrants | Guatemala | 23.2 /100 | #203 | Fair 12.2% |
| Kenyans | 21.8 /100 | #204 | Fair 12.2% |
| Immigrants | Costa Rica | 21.3 /100 | #205 | Fair 12.2% |
| Slovaks | 21.0 /100 | #206 | Fair 12.2% |
| Mexicans | 21.0 /100 | #207 | Fair 12.2% |
| Immigrants | Ghana | 18.8 /100 | #208 | Poor 12.2% |
| Immigrants | Trinidad and Tobago | 17.8 /100 | #209 | Poor 12.2% |
| Slavs | 17.0 /100 | #210 | Poor 12.2% |
Demographics Similar to Germans by Divorced or Separated
In terms of divorced or separated, the demographic groups most similar to Germans are Nepalese (12.5%, a difference of 0.020%), Immigrants from West Indies (12.5%, a difference of 0.030%), Finnish (12.5%, a difference of 0.040%), Hispanic or Latino (12.5%, a difference of 0.050%), and Alaska Native (12.4%, a difference of 0.27%).
| Demographics | Rating | Rank | Divorced or Separated |
| British West Indians | 3.7 /100 | #240 | Tragic 12.4% |
| Uruguayans | 3.4 /100 | #241 | Tragic 12.4% |
| Dutch | 3.1 /100 | #242 | Tragic 12.4% |
| Immigrants | Latin America | 2.8 /100 | #243 | Tragic 12.4% |
| Alaska Natives | 2.5 /100 | #244 | Tragic 12.4% |
| Hispanics or Latinos | 2.0 /100 | #245 | Tragic 12.5% |
| Immigrants | West Indies | 1.9 /100 | #246 | Tragic 12.5% |
| Germans | 1.8 /100 | #247 | Tragic 12.5% |
| Nepalese | 1.8 /100 | #248 | Tragic 12.5% |
| Finns | 1.8 /100 | #249 | Tragic 12.5% |
| Irish | 1.3 /100 | #250 | Tragic 12.5% |
| Aleuts | 1.3 /100 | #251 | Tragic 12.5% |
| Liberians | 0.9 /100 | #252 | Tragic 12.6% |
| Somalis | 0.9 /100 | #253 | Tragic 12.6% |
| Senegalese | 0.8 /100 | #254 | Tragic 12.6% |