Mongolian vs Somali Births to Unmarried Women
COMPARE
Mongolian
Somali
Births to Unmarried Women
Births to Unmarried Women Comparison
Mongolians
Somalis
27.9%
BIRTHS TO UNMARRIED WOMEN
99.3/ 100
METRIC RATING
55th/ 347
METRIC RANK
30.7%
BIRTHS TO UNMARRIED WOMEN
77.8/ 100
METRIC RATING
150th/ 347
METRIC RANK
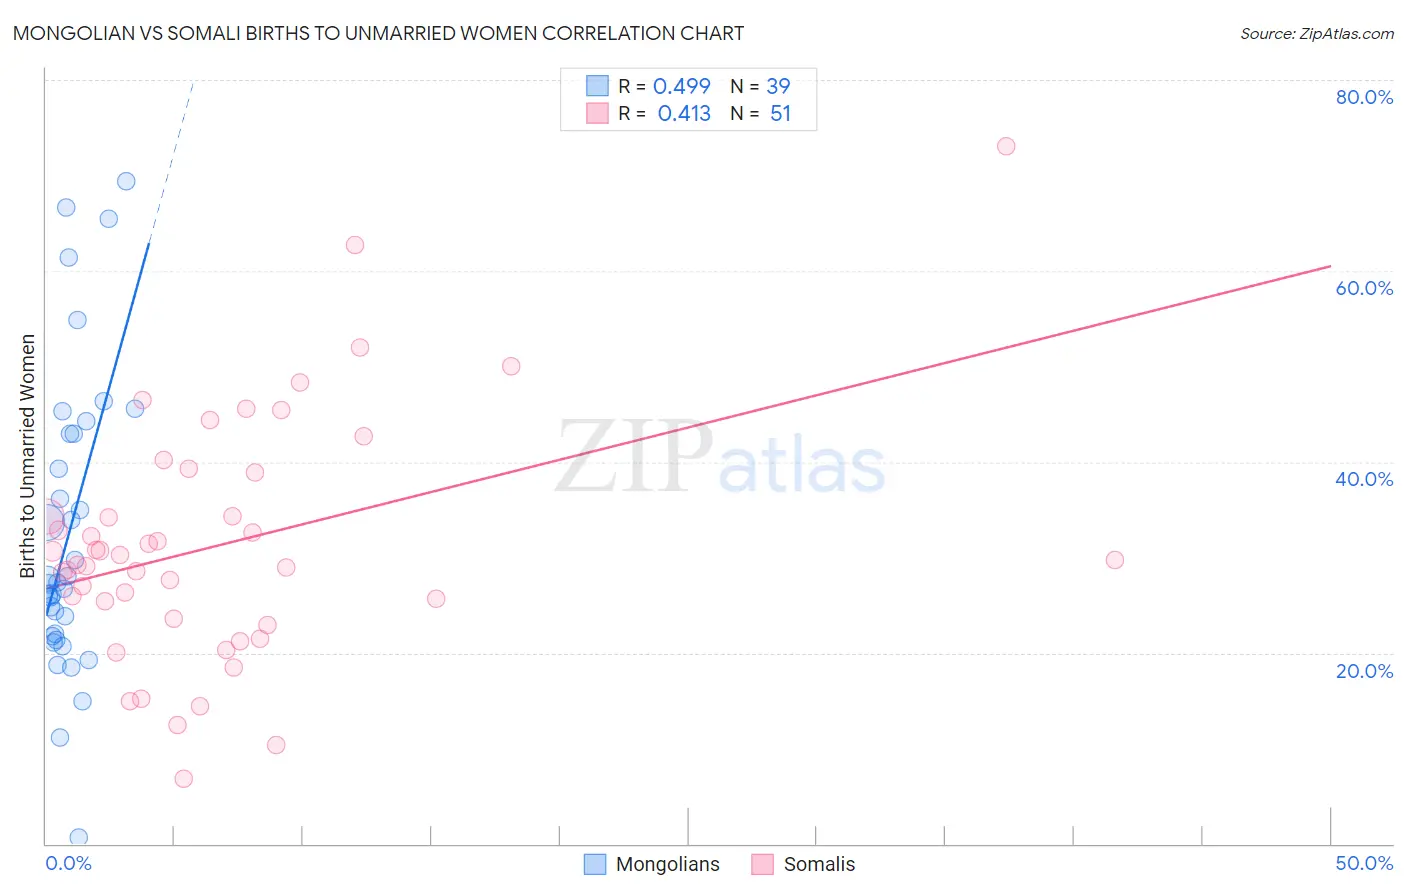
Mongolian vs Somali Births to Unmarried Women Correlation Chart
The statistical analysis conducted on geographies consisting of 135,823,191 people shows a moderate positive correlation between the proportion of Mongolians and percentage of births to unmarried women in the United States with a correlation coefficient (R) of 0.499 and weighted average of 27.9%. Similarly, the statistical analysis conducted on geographies consisting of 97,449,396 people shows a moderate positive correlation between the proportion of Somalis and percentage of births to unmarried women in the United States with a correlation coefficient (R) of 0.413 and weighted average of 30.7%, a difference of 10.1%.
Births to Unmarried Women Correlation Summary
| Measurement | Mongolian | Somali |
| Minimum | 0.60% | 6.8% |
| Maximum | 69.4% | 73.0% |
| Range | 68.8% | 66.2% |
| Mean | 32.6% | 31.3% |
| Median | 27.3% | 29.7% |
| Interquartile 25% (IQ1) | 21.7% | 23.6% |
| Interquartile 75% (IQ3) | 42.9% | 39.0% |
| Interquartile Range (IQR) | 21.2% | 15.4% |
| Standard Deviation (Sample) | 15.7% | 12.7% |
| Standard Deviation (Population) | 15.5% | 12.6% |
Similar Demographics by Births to Unmarried Women
Demographics Similar to Mongolians by Births to Unmarried Women
In terms of births to unmarried women, the demographic groups most similar to Mongolians are Afghan (27.9%, a difference of 0.040%), Immigrants from Romania (27.9%, a difference of 0.11%), Bhutanese (27.9%, a difference of 0.12%), Macedonian (27.9%, a difference of 0.16%), and Immigrants from Belgium (28.0%, a difference of 0.26%).
| Demographics | Rating | Rank | Births to Unmarried Women |
| Eastern Europeans | 99.5 /100 | #48 | Exceptional 27.7% |
| Immigrants | Greece | 99.4 /100 | #49 | Exceptional 27.8% |
| Maltese | 99.4 /100 | #50 | Exceptional 27.8% |
| Macedonians | 99.4 /100 | #51 | Exceptional 27.9% |
| Bhutanese | 99.4 /100 | #52 | Exceptional 27.9% |
| Immigrants | Romania | 99.4 /100 | #53 | Exceptional 27.9% |
| Afghans | 99.4 /100 | #54 | Exceptional 27.9% |
| Mongolians | 99.3 /100 | #55 | Exceptional 27.9% |
| Immigrants | Belgium | 99.3 /100 | #56 | Exceptional 28.0% |
| Russians | 99.2 /100 | #57 | Exceptional 28.0% |
| Immigrants | Albania | 99.2 /100 | #58 | Exceptional 28.0% |
| Immigrants | Kazakhstan | 99.1 /100 | #59 | Exceptional 28.1% |
| Immigrants | Turkey | 99.1 /100 | #60 | Exceptional 28.1% |
| Immigrants | North Macedonia | 99.1 /100 | #61 | Exceptional 28.1% |
| Egyptians | 99.0 /100 | #62 | Exceptional 28.2% |
Demographics Similar to Somalis by Births to Unmarried Women
In terms of births to unmarried women, the demographic groups most similar to Somalis are Italian (30.8%, a difference of 0.11%), Serbian (30.7%, a difference of 0.14%), Chilean (30.7%, a difference of 0.19%), Polish (30.8%, a difference of 0.22%), and British (30.8%, a difference of 0.24%).
| Demographics | Rating | Rank | Births to Unmarried Women |
| Immigrants | Uganda | 82.6 /100 | #143 | Excellent 30.5% |
| Czechs | 82.1 /100 | #144 | Excellent 30.5% |
| Immigrants | North America | 81.5 /100 | #145 | Excellent 30.6% |
| Northern Europeans | 81.4 /100 | #146 | Excellent 30.6% |
| Immigrants | Oceania | 81.2 /100 | #147 | Excellent 30.6% |
| Chileans | 79.1 /100 | #148 | Good 30.7% |
| Serbians | 78.8 /100 | #149 | Good 30.7% |
| Somalis | 77.8 /100 | #150 | Good 30.7% |
| Italians | 77.0 /100 | #151 | Good 30.8% |
| Poles | 76.2 /100 | #152 | Good 30.8% |
| British | 76.0 /100 | #153 | Good 30.8% |
| Yugoslavians | 75.1 /100 | #154 | Good 30.8% |
| Immigrants | Bangladesh | 73.9 /100 | #155 | Good 30.9% |
| Carpatho Rusyns | 73.5 /100 | #156 | Good 30.9% |
| Immigrants | Eastern Africa | 72.1 /100 | #157 | Good 31.0% |