Mongolian vs Immigrants from Bolivia Births to Unmarried Women
COMPARE
Mongolian
Immigrants from Bolivia
Births to Unmarried Women
Births to Unmarried Women Comparison
Mongolians
Immigrants from Bolivia
27.9%
BIRTHS TO UNMARRIED WOMEN
99.3/ 100
METRIC RATING
55th/ 347
METRIC RANK
28.6%
BIRTHS TO UNMARRIED WOMEN
98.5/ 100
METRIC RATING
74th/ 347
METRIC RANK
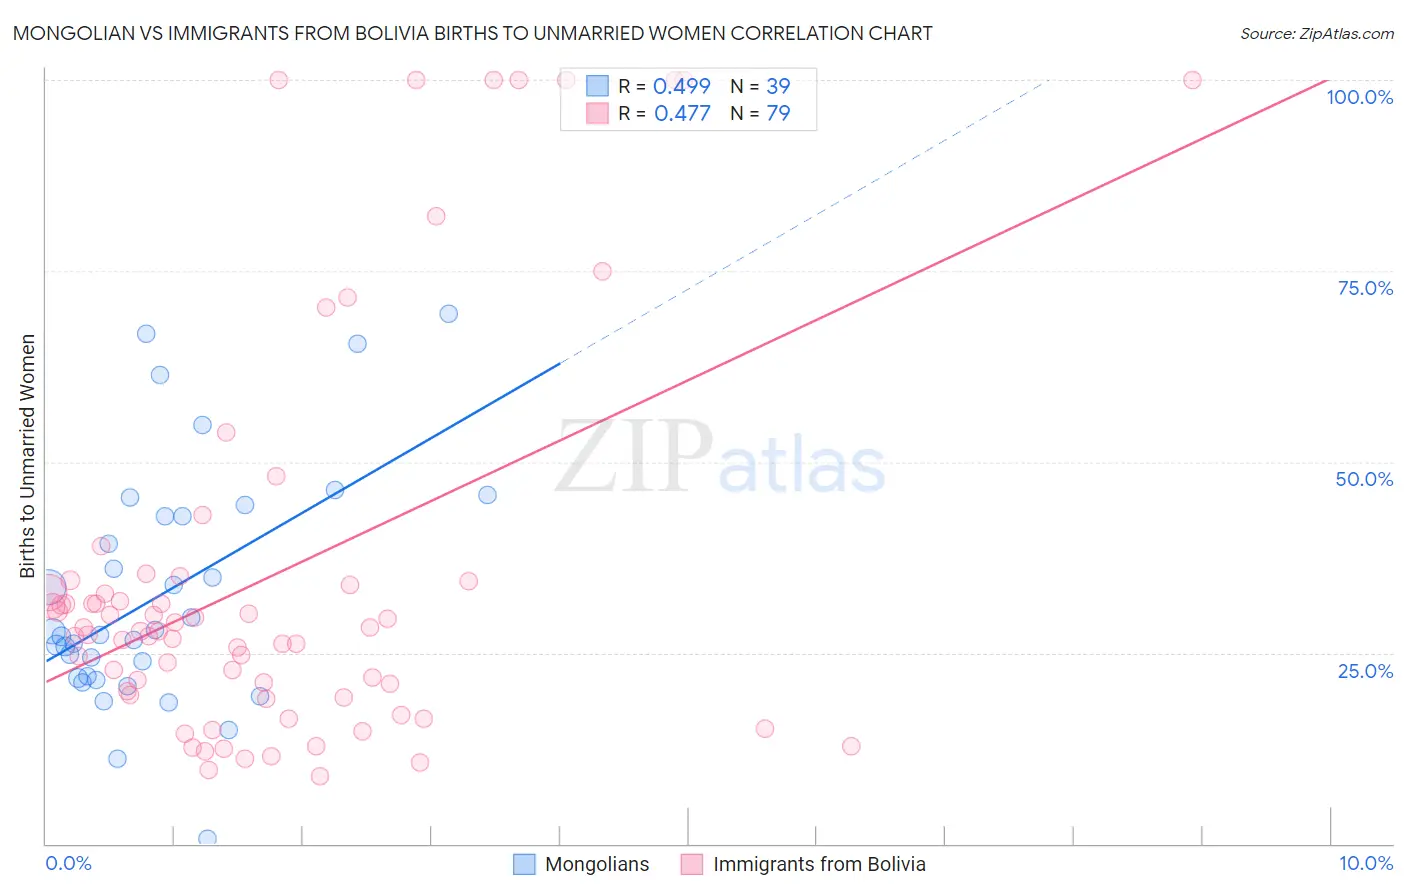
Mongolian vs Immigrants from Bolivia Births to Unmarried Women Correlation Chart
The statistical analysis conducted on geographies consisting of 135,823,191 people shows a moderate positive correlation between the proportion of Mongolians and percentage of births to unmarried women in the United States with a correlation coefficient (R) of 0.499 and weighted average of 27.9%. Similarly, the statistical analysis conducted on geographies consisting of 153,801,306 people shows a moderate positive correlation between the proportion of Immigrants from Bolivia and percentage of births to unmarried women in the United States with a correlation coefficient (R) of 0.477 and weighted average of 28.6%, a difference of 2.3%.
Births to Unmarried Women Correlation Summary
| Measurement | Mongolian | Immigrants from Bolivia |
| Minimum | 0.60% | 8.9% |
| Maximum | 69.4% | 100.0% |
| Range | 68.8% | 91.1% |
| Mean | 32.6% | 35.2% |
| Median | 27.3% | 27.9% |
| Interquartile 25% (IQ1) | 21.7% | 19.4% |
| Interquartile 75% (IQ3) | 42.9% | 34.4% |
| Interquartile Range (IQR) | 21.2% | 15.0% |
| Standard Deviation (Sample) | 15.7% | 25.9% |
| Standard Deviation (Population) | 15.5% | 25.8% |
Demographics Similar to Mongolians and Immigrants from Bolivia by Births to Unmarried Women
In terms of births to unmarried women, the demographic groups most similar to Mongolians are Afghan (27.9%, a difference of 0.040%), Immigrants from Belgium (28.0%, a difference of 0.26%), Russian (28.0%, a difference of 0.39%), Immigrants from Albania (28.0%, a difference of 0.50%), and Immigrants from Kazakhstan (28.1%, a difference of 0.76%). Similarly, the demographic groups most similar to Immigrants from Bolivia are Albanian (28.5%, a difference of 0.020%), Immigrants from Sweden (28.5%, a difference of 0.070%), Jordanian (28.5%, a difference of 0.13%), Laotian (28.5%, a difference of 0.31%), and Bolivian (28.5%, a difference of 0.37%).
| Demographics | Rating | Rank | Births to Unmarried Women |
| Afghans | 99.4 /100 | #54 | Exceptional 27.9% |
| Mongolians | 99.3 /100 | #55 | Exceptional 27.9% |
| Immigrants | Belgium | 99.3 /100 | #56 | Exceptional 28.0% |
| Russians | 99.2 /100 | #57 | Exceptional 28.0% |
| Immigrants | Albania | 99.2 /100 | #58 | Exceptional 28.0% |
| Immigrants | Kazakhstan | 99.1 /100 | #59 | Exceptional 28.1% |
| Immigrants | Turkey | 99.1 /100 | #60 | Exceptional 28.1% |
| Immigrants | North Macedonia | 99.1 /100 | #61 | Exceptional 28.1% |
| Egyptians | 99.0 /100 | #62 | Exceptional 28.2% |
| Immigrants | Serbia | 98.9 /100 | #63 | Exceptional 28.3% |
| Tongans | 98.8 /100 | #64 | Exceptional 28.4% |
| Immigrants | Czechoslovakia | 98.8 /100 | #65 | Exceptional 28.4% |
| Immigrants | Egypt | 98.8 /100 | #66 | Exceptional 28.4% |
| Palestinians | 98.7 /100 | #67 | Exceptional 28.4% |
| Immigrants | Europe | 98.7 /100 | #68 | Exceptional 28.4% |
| Bolivians | 98.7 /100 | #69 | Exceptional 28.5% |
| Laotians | 98.6 /100 | #70 | Exceptional 28.5% |
| Jordanians | 98.5 /100 | #71 | Exceptional 28.5% |
| Immigrants | Sweden | 98.5 /100 | #72 | Exceptional 28.5% |
| Albanians | 98.5 /100 | #73 | Exceptional 28.5% |
| Immigrants | Bolivia | 98.5 /100 | #74 | Exceptional 28.6% |