Colville vs Immigrants from Latvia Divorced or Separated
COMPARE
Colville
Immigrants from Latvia
Divorced or Separated
Divorced or Separated Comparison
Colville
Immigrants from Latvia
14.2%
DIVORCED OR SEPARATED
0.0/ 100
METRIC RATING
339th/ 347
METRIC RANK
11.6%
DIVORCED OR SEPARATED
99.2/ 100
METRIC RATING
86th/ 347
METRIC RANK
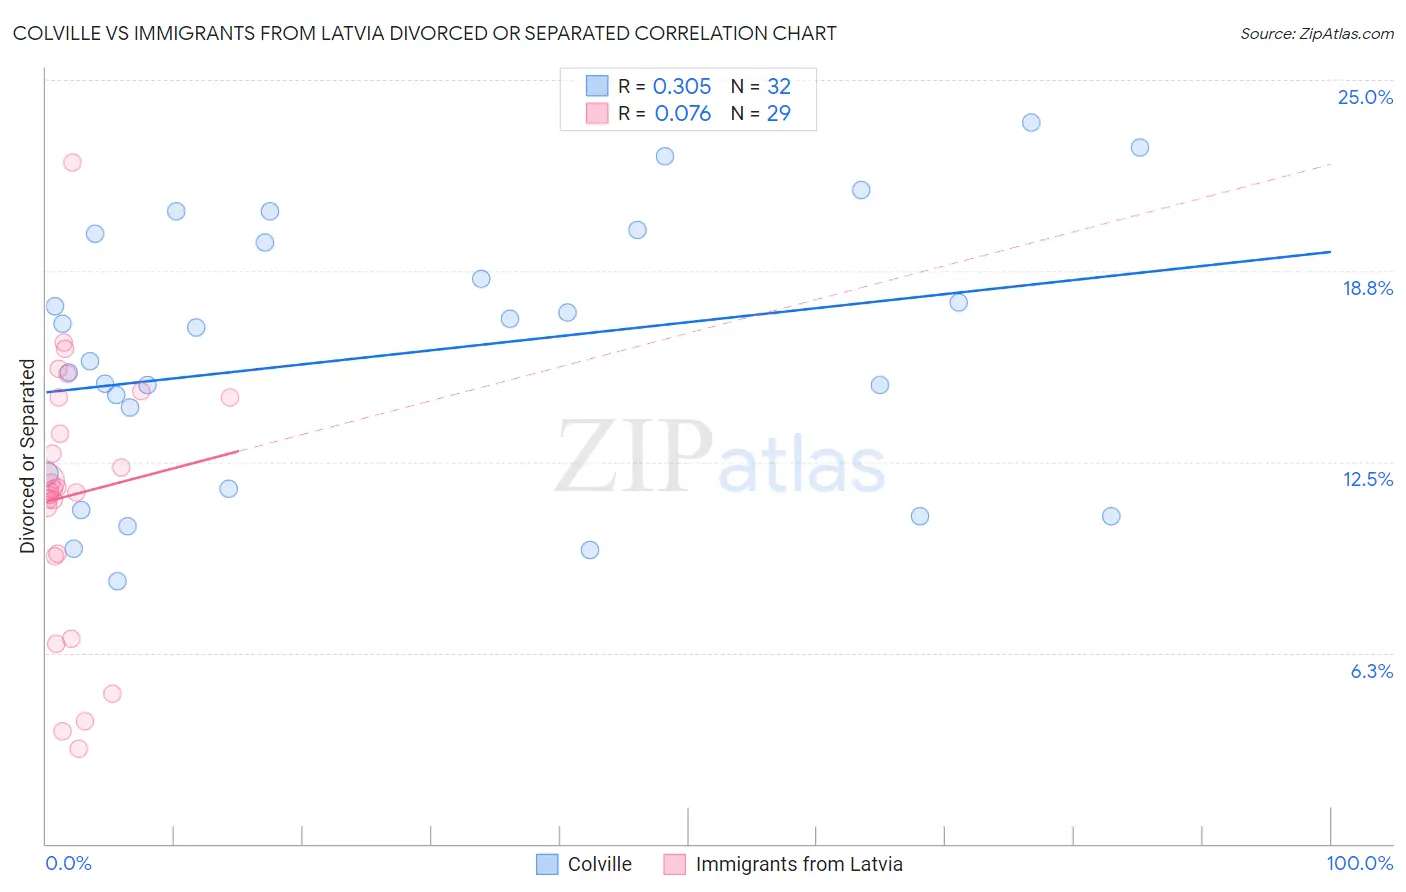
Colville vs Immigrants from Latvia Divorced or Separated Correlation Chart
The statistical analysis conducted on geographies consisting of 34,683,925 people shows a mild positive correlation between the proportion of Colville and percentage of population currently divorced or separated in the United States with a correlation coefficient (R) of 0.305 and weighted average of 14.2%. Similarly, the statistical analysis conducted on geographies consisting of 113,726,313 people shows a slight positive correlation between the proportion of Immigrants from Latvia and percentage of population currently divorced or separated in the United States with a correlation coefficient (R) of 0.076 and weighted average of 11.6%, a difference of 22.9%.
Divorced or Separated Correlation Summary
| Measurement | Colville | Immigrants from Latvia |
| Minimum | 8.6% | 3.1% |
| Maximum | 23.6% | 22.3% |
| Range | 15.0% | 19.2% |
| Mean | 16.0% | 11.4% |
| Median | 16.4% | 11.6% |
| Interquartile 25% (IQ1) | 11.9% | 9.5% |
| Interquartile 75% (IQ3) | 19.8% | 14.6% |
| Interquartile Range (IQR) | 8.0% | 5.1% |
| Standard Deviation (Sample) | 4.3% | 4.3% |
| Standard Deviation (Population) | 4.2% | 4.2% |
Similar Demographics by Divorced or Separated
Demographics Similar to Colville by Divorced or Separated
In terms of divorced or separated, the demographic groups most similar to Colville are Chickasaw (14.2%, a difference of 0.040%), Bahamian (14.2%, a difference of 0.24%), Seminole (14.3%, a difference of 0.40%), Choctaw (14.1%, a difference of 0.53%), and Crow (14.1%, a difference of 0.84%).
| Demographics | Rating | Rank | Divorced or Separated |
| Cherokee | 0.0 /100 | #332 | Tragic 13.7% |
| Puerto Ricans | 0.0 /100 | #333 | Tragic 13.9% |
| Immigrants | Bahamas | 0.0 /100 | #334 | Tragic 13.9% |
| Dutch West Indians | 0.0 /100 | #335 | Tragic 14.0% |
| Shoshone | 0.0 /100 | #336 | Tragic 14.0% |
| Crow | 0.0 /100 | #337 | Tragic 14.1% |
| Choctaw | 0.0 /100 | #338 | Tragic 14.1% |
| Colville | 0.0 /100 | #339 | Tragic 14.2% |
| Chickasaw | 0.0 /100 | #340 | Tragic 14.2% |
| Bahamians | 0.0 /100 | #341 | Tragic 14.2% |
| Seminole | 0.0 /100 | #342 | Tragic 14.3% |
| Creek | 0.0 /100 | #343 | Tragic 14.4% |
| Cubans | 0.0 /100 | #344 | Tragic 14.5% |
| Kiowa | 0.0 /100 | #345 | Tragic 14.5% |
| Arapaho | 0.0 /100 | #346 | Tragic 14.8% |
Demographics Similar to Immigrants from Latvia by Divorced or Separated
In terms of divorced or separated, the demographic groups most similar to Immigrants from Latvia are Immigrants from Nepal (11.6%, a difference of 0.030%), Immigrants from Europe (11.6%, a difference of 0.050%), Immigrants from Albania (11.5%, a difference of 0.070%), Immigrants from Southern Europe (11.6%, a difference of 0.090%), and Bulgarian (11.5%, a difference of 0.13%).
| Demographics | Rating | Rank | Divorced or Separated |
| Guyanese | 99.4 /100 | #79 | Exceptional 11.5% |
| Immigrants | Switzerland | 99.4 /100 | #80 | Exceptional 11.5% |
| Russians | 99.4 /100 | #81 | Exceptional 11.5% |
| Immigrants | Romania | 99.3 /100 | #82 | Exceptional 11.5% |
| Immigrants | Bulgaria | 99.3 /100 | #83 | Exceptional 11.5% |
| Bulgarians | 99.3 /100 | #84 | Exceptional 11.5% |
| Immigrants | Albania | 99.3 /100 | #85 | Exceptional 11.5% |
| Immigrants | Latvia | 99.2 /100 | #86 | Exceptional 11.6% |
| Immigrants | Nepal | 99.2 /100 | #87 | Exceptional 11.6% |
| Immigrants | Europe | 99.2 /100 | #88 | Exceptional 11.6% |
| Immigrants | Southern Europe | 99.1 /100 | #89 | Exceptional 11.6% |
| Zimbabweans | 99.0 /100 | #90 | Exceptional 11.6% |
| Spanish American Indians | 99.0 /100 | #91 | Exceptional 11.6% |
| Immigrants | Denmark | 98.9 /100 | #92 | Exceptional 11.6% |
| Arabs | 98.9 /100 | #93 | Exceptional 11.6% |