Sierra Leonean vs Immigrants from Latvia Divorced or Separated
COMPARE
Sierra Leonean
Immigrants from Latvia
Divorced or Separated
Divorced or Separated Comparison
Sierra Leoneans
Immigrants from Latvia
12.1%
DIVORCED OR SEPARATED
35.5/ 100
METRIC RATING
189th/ 347
METRIC RANK
11.6%
DIVORCED OR SEPARATED
99.2/ 100
METRIC RATING
86th/ 347
METRIC RANK
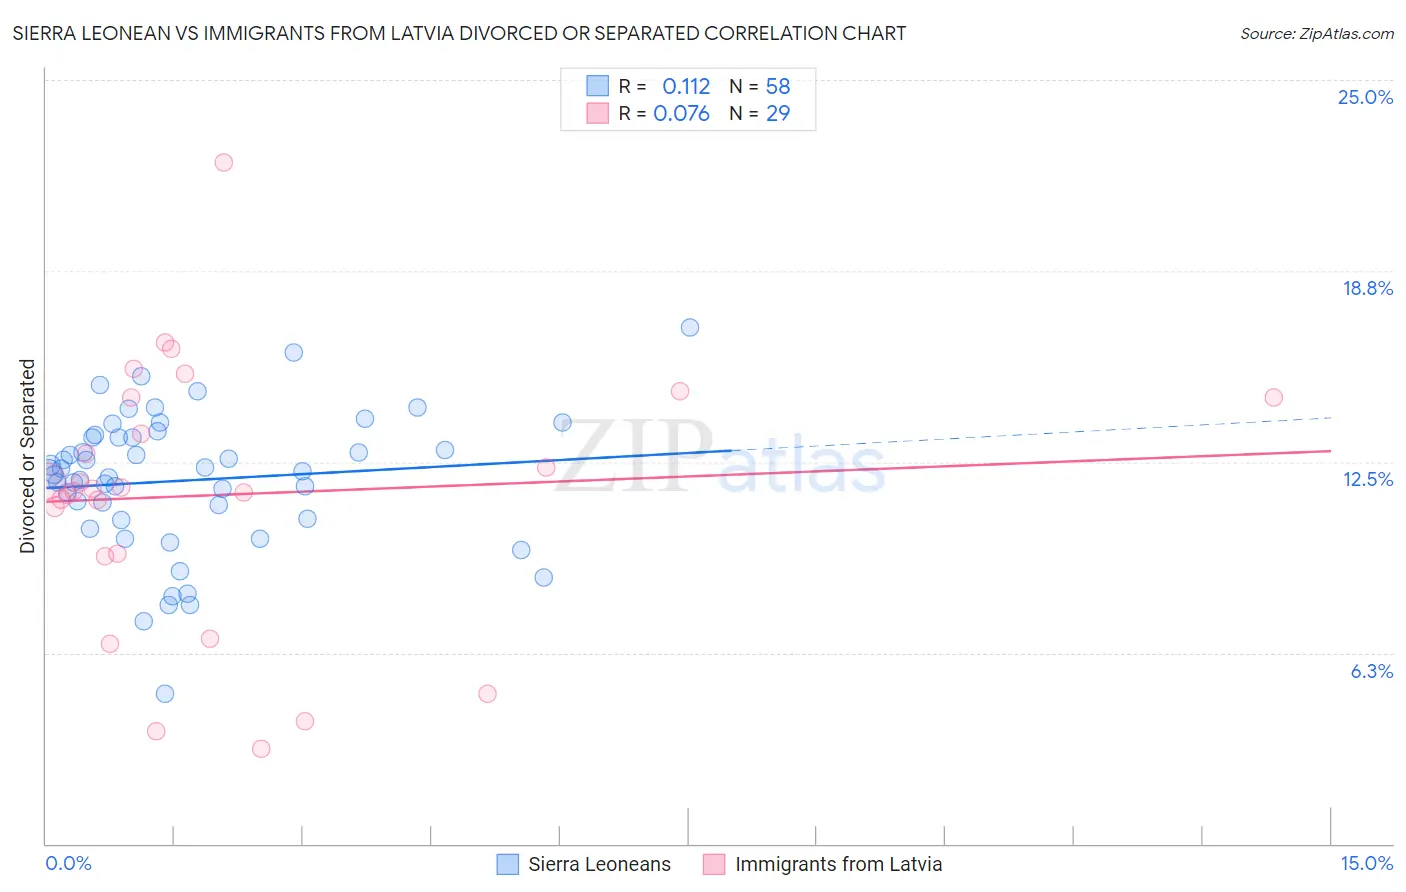
Sierra Leonean vs Immigrants from Latvia Divorced or Separated Correlation Chart
The statistical analysis conducted on geographies consisting of 83,352,562 people shows a poor positive correlation between the proportion of Sierra Leoneans and percentage of population currently divorced or separated in the United States with a correlation coefficient (R) of 0.112 and weighted average of 12.1%. Similarly, the statistical analysis conducted on geographies consisting of 113,726,313 people shows a slight positive correlation between the proportion of Immigrants from Latvia and percentage of population currently divorced or separated in the United States with a correlation coefficient (R) of 0.076 and weighted average of 11.6%, a difference of 4.9%.
Divorced or Separated Correlation Summary
| Measurement | Sierra Leonean | Immigrants from Latvia |
| Minimum | 4.9% | 3.1% |
| Maximum | 16.9% | 22.3% |
| Range | 12.0% | 19.2% |
| Mean | 11.9% | 11.4% |
| Median | 12.2% | 11.6% |
| Interquartile 25% (IQ1) | 10.6% | 9.5% |
| Interquartile 75% (IQ3) | 13.3% | 14.6% |
| Interquartile Range (IQR) | 2.7% | 5.1% |
| Standard Deviation (Sample) | 2.3% | 4.3% |
| Standard Deviation (Population) | 2.3% | 4.2% |
Similar Demographics by Divorced or Separated
Demographics Similar to Sierra Leoneans by Divorced or Separated
In terms of divorced or separated, the demographic groups most similar to Sierra Leoneans are Moroccan (12.1%, a difference of 0.030%), Swedish (12.1%, a difference of 0.040%), Belizean (12.1%, a difference of 0.080%), Immigrants from Belize (12.1%, a difference of 0.080%), and Norwegian (12.1%, a difference of 0.090%).
| Demographics | Rating | Rank | Divorced or Separated |
| Immigrants | Ethiopia | 43.1 /100 | #182 | Average 12.1% |
| Immigrants | Central America | 42.9 /100 | #183 | Average 12.1% |
| Immigrants | North America | 41.1 /100 | #184 | Average 12.1% |
| Immigrants | Nigeria | 40.5 /100 | #185 | Average 12.1% |
| Immigrants | Chile | 39.0 /100 | #186 | Fair 12.1% |
| Belizeans | 37.7 /100 | #187 | Fair 12.1% |
| Immigrants | Belize | 37.6 /100 | #188 | Fair 12.1% |
| Sierra Leoneans | 35.5 /100 | #189 | Fair 12.1% |
| Moroccans | 34.8 /100 | #190 | Fair 12.1% |
| Swedes | 34.4 /100 | #191 | Fair 12.1% |
| Norwegians | 33.2 /100 | #192 | Fair 12.1% |
| Immigrants | Thailand | 32.5 /100 | #193 | Fair 12.1% |
| Immigrants | Eritrea | 31.9 /100 | #194 | Fair 12.1% |
| Immigrants | England | 31.4 /100 | #195 | Fair 12.1% |
| Immigrants | Burma/Myanmar | 30.4 /100 | #196 | Fair 12.1% |
Demographics Similar to Immigrants from Latvia by Divorced or Separated
In terms of divorced or separated, the demographic groups most similar to Immigrants from Latvia are Immigrants from Nepal (11.6%, a difference of 0.030%), Immigrants from Europe (11.6%, a difference of 0.050%), Immigrants from Albania (11.5%, a difference of 0.070%), Immigrants from Southern Europe (11.6%, a difference of 0.090%), and Bulgarian (11.5%, a difference of 0.13%).
| Demographics | Rating | Rank | Divorced or Separated |
| Guyanese | 99.4 /100 | #79 | Exceptional 11.5% |
| Immigrants | Switzerland | 99.4 /100 | #80 | Exceptional 11.5% |
| Russians | 99.4 /100 | #81 | Exceptional 11.5% |
| Immigrants | Romania | 99.3 /100 | #82 | Exceptional 11.5% |
| Immigrants | Bulgaria | 99.3 /100 | #83 | Exceptional 11.5% |
| Bulgarians | 99.3 /100 | #84 | Exceptional 11.5% |
| Immigrants | Albania | 99.3 /100 | #85 | Exceptional 11.5% |
| Immigrants | Latvia | 99.2 /100 | #86 | Exceptional 11.6% |
| Immigrants | Nepal | 99.2 /100 | #87 | Exceptional 11.6% |
| Immigrants | Europe | 99.2 /100 | #88 | Exceptional 11.6% |
| Immigrants | Southern Europe | 99.1 /100 | #89 | Exceptional 11.6% |
| Zimbabweans | 99.0 /100 | #90 | Exceptional 11.6% |
| Spanish American Indians | 99.0 /100 | #91 | Exceptional 11.6% |
| Immigrants | Denmark | 98.9 /100 | #92 | Exceptional 11.6% |
| Arabs | 98.9 /100 | #93 | Exceptional 11.6% |