Mexican American Indian vs Immigrants from Zimbabwe Divorced or Separated
COMPARE
Mexican American Indian
Immigrants from Zimbabwe
Divorced or Separated
Divorced or Separated Comparison
Mexican American Indians
Immigrants from Zimbabwe
12.0%
DIVORCED OR SEPARATED
55.8/ 100
METRIC RATING
170th/ 347
METRIC RANK
11.9%
DIVORCED OR SEPARATED
81.5/ 100
METRIC RATING
142nd/ 347
METRIC RANK
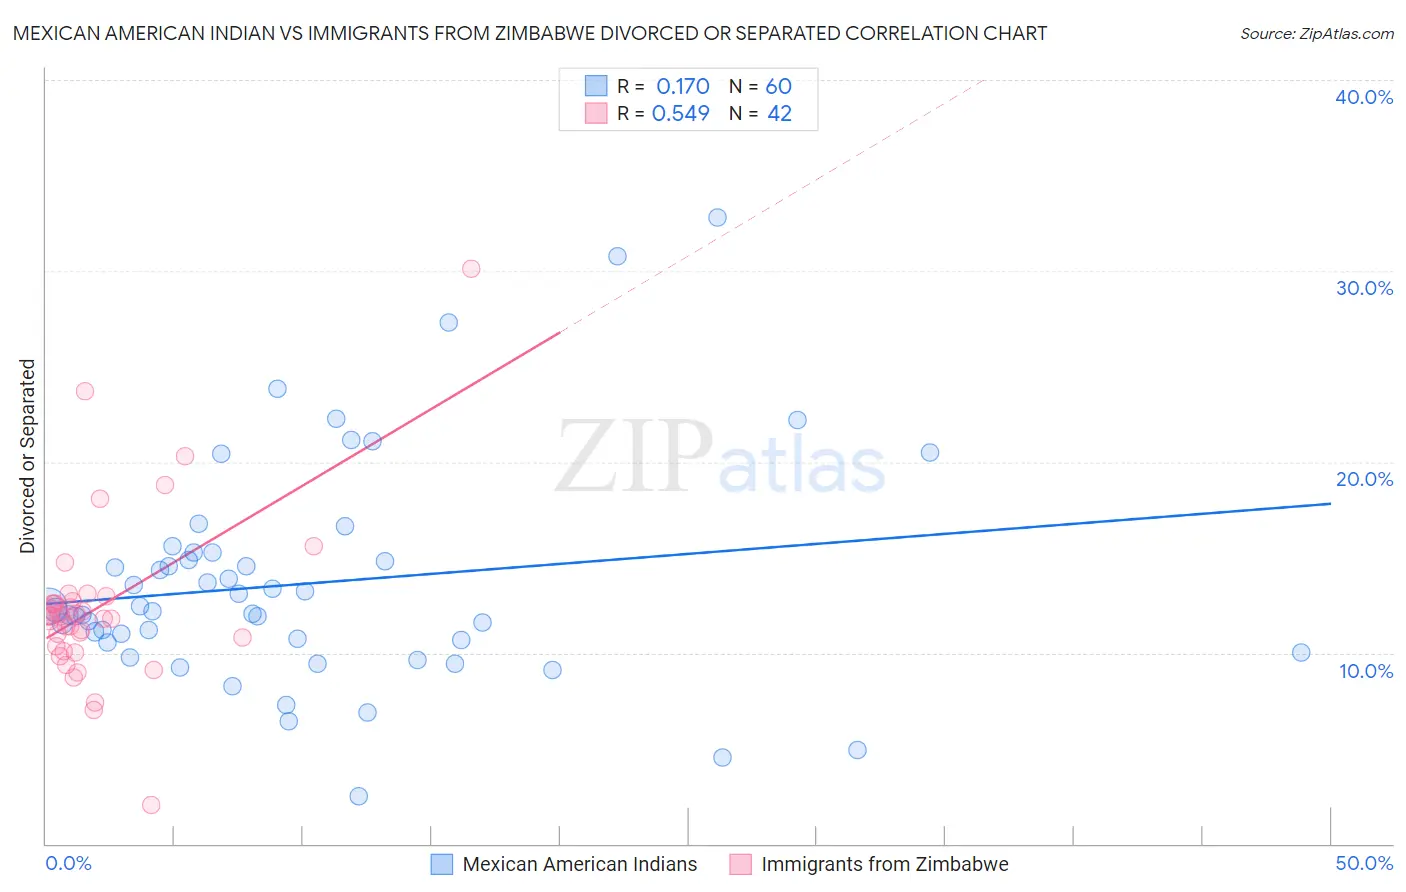
Mexican American Indian vs Immigrants from Zimbabwe Divorced or Separated Correlation Chart
The statistical analysis conducted on geographies consisting of 317,554,193 people shows a poor positive correlation between the proportion of Mexican American Indians and percentage of population currently divorced or separated in the United States with a correlation coefficient (R) of 0.170 and weighted average of 12.0%. Similarly, the statistical analysis conducted on geographies consisting of 117,798,531 people shows a substantial positive correlation between the proportion of Immigrants from Zimbabwe and percentage of population currently divorced or separated in the United States with a correlation coefficient (R) of 0.549 and weighted average of 11.9%, a difference of 1.1%.
Divorced or Separated Correlation Summary
| Measurement | Mexican American Indian | Immigrants from Zimbabwe |
| Minimum | 2.5% | 2.0% |
| Maximum | 32.8% | 30.1% |
| Range | 30.3% | 28.1% |
| Mean | 13.6% | 12.4% |
| Median | 12.2% | 11.9% |
| Interquartile 25% (IQ1) | 10.6% | 10.4% |
| Interquartile 75% (IQ3) | 15.0% | 12.7% |
| Interquartile Range (IQR) | 4.4% | 2.4% |
| Standard Deviation (Sample) | 5.8% | 4.5% |
| Standard Deviation (Population) | 5.8% | 4.5% |
Similar Demographics by Divorced or Separated
Demographics Similar to Mexican American Indians by Divorced or Separated
In terms of divorced or separated, the demographic groups most similar to Mexican American Indians are Serbian (12.0%, a difference of 0.040%), Immigrants from Peru (12.0%, a difference of 0.040%), Costa Rican (12.0%, a difference of 0.090%), Immigrants from Mexico (12.0%, a difference of 0.090%), and Ethiopian (12.0%, a difference of 0.10%).
| Demographics | Rating | Rank | Divorced or Separated |
| Navajo | 63.9 /100 | #163 | Good 12.0% |
| Swiss | 63.6 /100 | #164 | Good 12.0% |
| German Russians | 61.8 /100 | #165 | Good 12.0% |
| Tohono O'odham | 60.4 /100 | #166 | Good 12.0% |
| Ethiopians | 58.5 /100 | #167 | Average 12.0% |
| Serbians | 57.1 /100 | #168 | Average 12.0% |
| Immigrants | Peru | 57.0 /100 | #169 | Average 12.0% |
| Mexican American Indians | 55.8 /100 | #170 | Average 12.0% |
| Costa Ricans | 53.3 /100 | #171 | Average 12.0% |
| Immigrants | Mexico | 53.2 /100 | #172 | Average 12.0% |
| Immigrants | Moldova | 50.4 /100 | #173 | Average 12.1% |
| Hawaiians | 50.0 /100 | #174 | Average 12.1% |
| Immigrants | Sierra Leone | 50.0 /100 | #175 | Average 12.1% |
| Pennsylvania Germans | 48.9 /100 | #176 | Average 12.1% |
| Brazilians | 47.7 /100 | #177 | Average 12.1% |
Demographics Similar to Immigrants from Zimbabwe by Divorced or Separated
In terms of divorced or separated, the demographic groups most similar to Immigrants from Zimbabwe are Pakistani (11.9%, a difference of 0.010%), Peruvian (11.9%, a difference of 0.030%), Croatian (11.9%, a difference of 0.050%), Immigrants from Morocco (11.9%, a difference of 0.090%), and Lebanese (11.9%, a difference of 0.12%).
| Demographics | Rating | Rank | Divorced or Separated |
| Danes | 84.8 /100 | #135 | Excellent 11.9% |
| Carpatho Rusyns | 84.8 /100 | #136 | Excellent 11.9% |
| Alsatians | 84.0 /100 | #137 | Excellent 11.9% |
| Immigrants | Netherlands | 83.9 /100 | #138 | Excellent 11.9% |
| Australians | 83.6 /100 | #139 | Excellent 11.9% |
| Lebanese | 83.4 /100 | #140 | Excellent 11.9% |
| Immigrants | Morocco | 82.9 /100 | #141 | Excellent 11.9% |
| Immigrants | Zimbabwe | 81.5 /100 | #142 | Excellent 11.9% |
| Pakistanis | 81.3 /100 | #143 | Excellent 11.9% |
| Peruvians | 80.9 /100 | #144 | Excellent 11.9% |
| Croatians | 80.6 /100 | #145 | Excellent 11.9% |
| Immigrants | Grenada | 79.1 /100 | #146 | Good 11.9% |
| Poles | 78.6 /100 | #147 | Good 11.9% |
| Italians | 77.8 /100 | #148 | Good 11.9% |
| Immigrants | Oceania | 77.7 /100 | #149 | Good 11.9% |