Mexican American Indian vs Argentinean Bachelor's Degree
COMPARE
Mexican American Indian
Argentinean
Bachelor's Degree
Bachelor's Degree Comparison
Mexican American Indians
Argentineans
30.2%
BACHELOR'S DEGREE
0.0/ 100
METRIC RATING
302nd/ 347
METRIC RANK
43.3%
BACHELOR'S DEGREE
99.7/ 100
METRIC RATING
64th/ 347
METRIC RANK
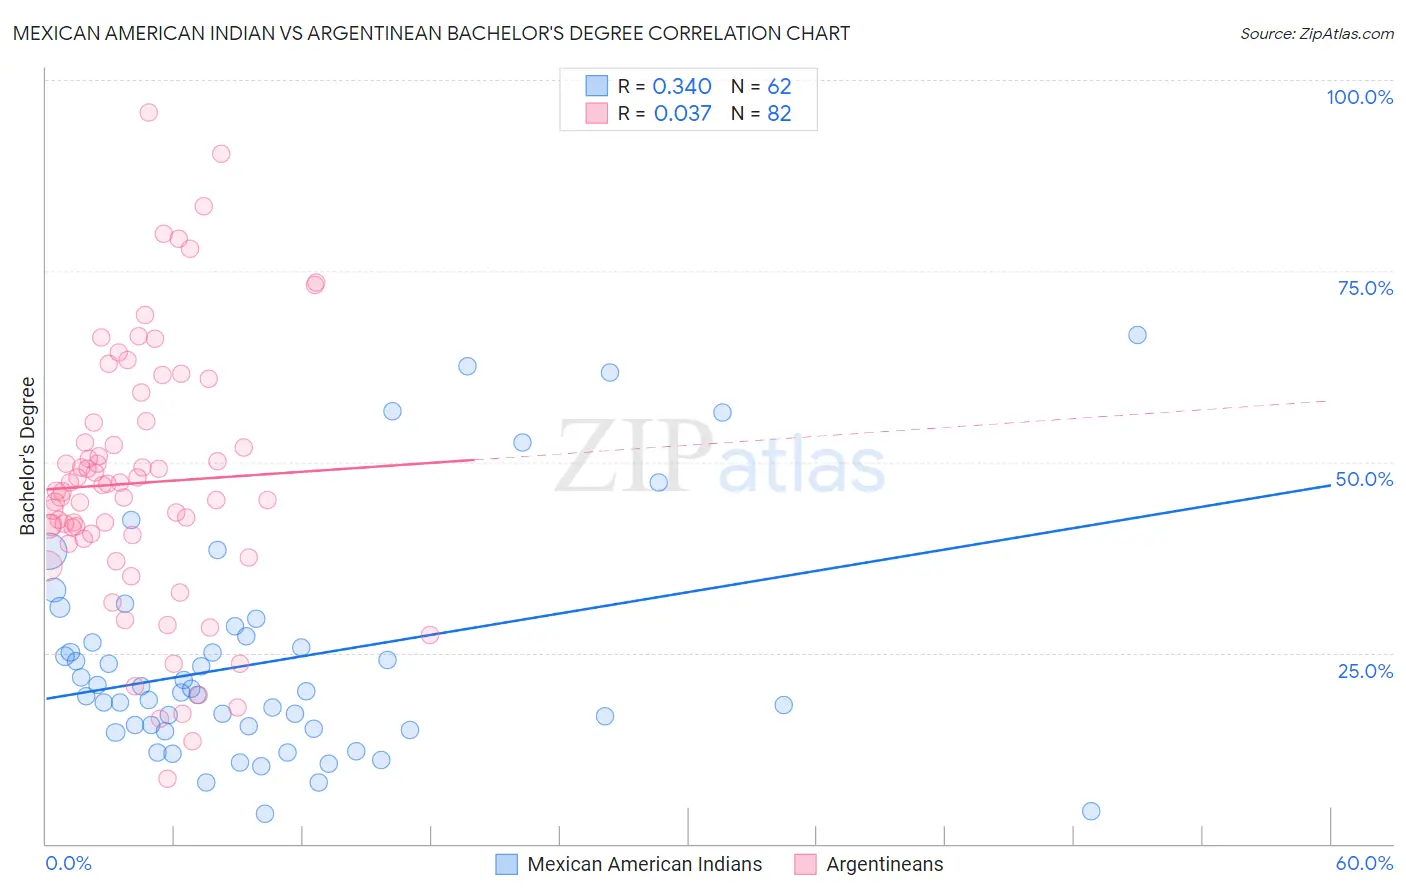
Mexican American Indian vs Argentinean Bachelor's Degree Correlation Chart
The statistical analysis conducted on geographies consisting of 317,609,381 people shows a mild positive correlation between the proportion of Mexican American Indians and percentage of population with at least bachelor's degree education in the United States with a correlation coefficient (R) of 0.340 and weighted average of 30.2%. Similarly, the statistical analysis conducted on geographies consisting of 297,127,531 people shows no correlation between the proportion of Argentineans and percentage of population with at least bachelor's degree education in the United States with a correlation coefficient (R) of 0.037 and weighted average of 43.3%, a difference of 43.1%.
Bachelor's Degree Correlation Summary
| Measurement | Mexican American Indian | Argentinean |
| Minimum | 3.9% | 8.5% |
| Maximum | 66.7% | 95.7% |
| Range | 62.8% | 87.3% |
| Mean | 24.0% | 47.2% |
| Median | 19.9% | 46.1% |
| Interquartile 25% (IQ1) | 15.0% | 39.9% |
| Interquartile 75% (IQ3) | 27.2% | 55.1% |
| Interquartile Range (IQR) | 12.2% | 15.2% |
| Standard Deviation (Sample) | 14.5% | 17.3% |
| Standard Deviation (Population) | 14.4% | 17.1% |
Similar Demographics by Bachelor's Degree
Demographics Similar to Mexican American Indians by Bachelor's Degree
In terms of bachelor's degree, the demographic groups most similar to Mexican American Indians are Bangladeshi (30.2%, a difference of 0.17%), Cherokee (30.2%, a difference of 0.17%), Immigrants from Cuba (30.3%, a difference of 0.28%), Immigrants from Micronesia (30.4%, a difference of 0.49%), and Chickasaw (30.4%, a difference of 0.51%).
| Demographics | Rating | Rank | Bachelor's Degree |
| Immigrants | Dominican Republic | 0.0 /100 | #295 | Tragic 30.7% |
| Puget Sound Salish | 0.0 /100 | #296 | Tragic 30.7% |
| Immigrants | Haiti | 0.0 /100 | #297 | Tragic 30.6% |
| Chippewa | 0.0 /100 | #298 | Tragic 30.6% |
| Chickasaw | 0.0 /100 | #299 | Tragic 30.4% |
| Immigrants | Micronesia | 0.0 /100 | #300 | Tragic 30.4% |
| Immigrants | Cuba | 0.0 /100 | #301 | Tragic 30.3% |
| Mexican American Indians | 0.0 /100 | #302 | Tragic 30.2% |
| Bangladeshis | 0.0 /100 | #303 | Tragic 30.2% |
| Cherokee | 0.0 /100 | #304 | Tragic 30.2% |
| Immigrants | Latin America | 0.0 /100 | #305 | Tragic 30.1% |
| Immigrants | Yemen | 0.0 /100 | #306 | Tragic 29.9% |
| Nepalese | 0.0 /100 | #307 | Tragic 29.9% |
| Cajuns | 0.0 /100 | #308 | Tragic 29.6% |
| Hispanics or Latinos | 0.0 /100 | #309 | Tragic 29.6% |
Demographics Similar to Argentineans by Bachelor's Degree
In terms of bachelor's degree, the demographic groups most similar to Argentineans are Zimbabwean (43.3%, a difference of 0.0%), Immigrants from Netherlands (43.3%, a difference of 0.020%), Egyptian (43.3%, a difference of 0.050%), Immigrants from Indonesia (43.3%, a difference of 0.070%), and Immigrants from Europe (43.4%, a difference of 0.27%).
| Demographics | Rating | Rank | Bachelor's Degree |
| Paraguayans | 99.9 /100 | #57 | Exceptional 44.0% |
| Immigrants | Czechoslovakia | 99.9 /100 | #58 | Exceptional 44.0% |
| Australians | 99.9 /100 | #59 | Exceptional 44.0% |
| New Zealanders | 99.9 /100 | #60 | Exceptional 44.0% |
| South Africans | 99.8 /100 | #61 | Exceptional 43.6% |
| Immigrants | Kazakhstan | 99.8 /100 | #62 | Exceptional 43.4% |
| Immigrants | Europe | 99.8 /100 | #63 | Exceptional 43.4% |
| Argentineans | 99.7 /100 | #64 | Exceptional 43.3% |
| Zimbabweans | 99.7 /100 | #65 | Exceptional 43.3% |
| Immigrants | Netherlands | 99.7 /100 | #66 | Exceptional 43.3% |
| Egyptians | 99.7 /100 | #67 | Exceptional 43.3% |
| Immigrants | Indonesia | 99.7 /100 | #68 | Exceptional 43.3% |
| Immigrants | Pakistan | 99.7 /100 | #69 | Exceptional 43.1% |
| Immigrants | Romania | 99.6 /100 | #70 | Exceptional 42.9% |
| Immigrants | Argentina | 99.6 /100 | #71 | Exceptional 42.8% |