Mexican American Indian vs Immigrants from Portugal Divorced or Separated
COMPARE
Mexican American Indian
Immigrants from Portugal
Divorced or Separated
Divorced or Separated Comparison
Mexican American Indians
Immigrants from Portugal
12.0%
DIVORCED OR SEPARATED
55.8/ 100
METRIC RATING
170th/ 347
METRIC RANK
11.9%
DIVORCED OR SEPARATED
77.3/ 100
METRIC RATING
150th/ 347
METRIC RANK
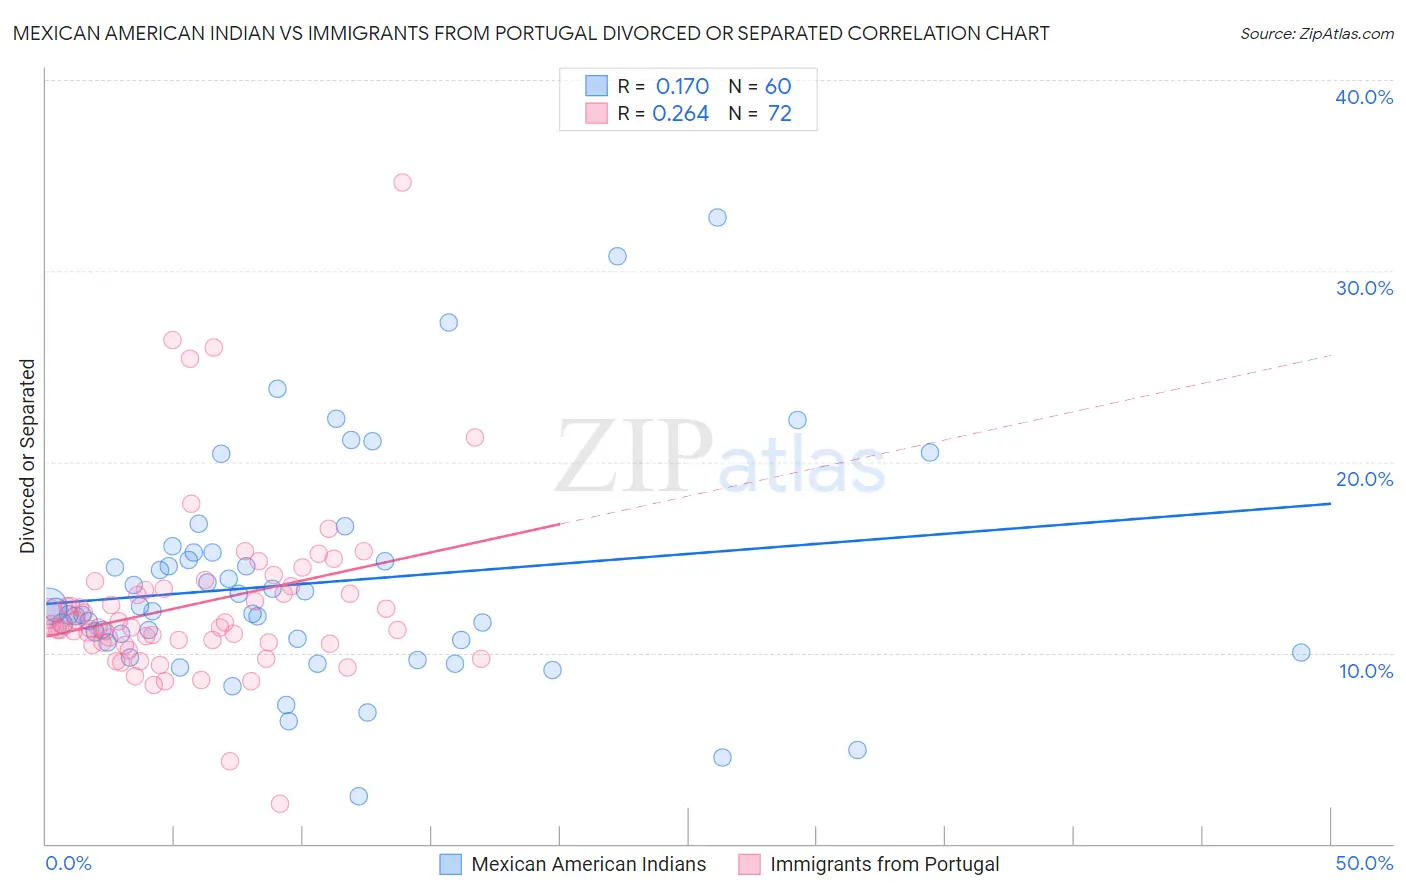
Mexican American Indian vs Immigrants from Portugal Divorced or Separated Correlation Chart
The statistical analysis conducted on geographies consisting of 317,554,193 people shows a poor positive correlation between the proportion of Mexican American Indians and percentage of population currently divorced or separated in the United States with a correlation coefficient (R) of 0.170 and weighted average of 12.0%. Similarly, the statistical analysis conducted on geographies consisting of 174,784,799 people shows a weak positive correlation between the proportion of Immigrants from Portugal and percentage of population currently divorced or separated in the United States with a correlation coefficient (R) of 0.264 and weighted average of 11.9%, a difference of 0.87%.
Divorced or Separated Correlation Summary
| Measurement | Mexican American Indian | Immigrants from Portugal |
| Minimum | 2.5% | 2.1% |
| Maximum | 32.8% | 34.6% |
| Range | 30.3% | 32.5% |
| Mean | 13.6% | 12.5% |
| Median | 12.2% | 11.3% |
| Interquartile 25% (IQ1) | 10.6% | 10.5% |
| Interquartile 75% (IQ3) | 15.0% | 13.3% |
| Interquartile Range (IQR) | 4.4% | 2.8% |
| Standard Deviation (Sample) | 5.8% | 4.7% |
| Standard Deviation (Population) | 5.8% | 4.7% |
Demographics Similar to Mexican American Indians and Immigrants from Portugal by Divorced or Separated
In terms of divorced or separated, the demographic groups most similar to Mexican American Indians are Serbian (12.0%, a difference of 0.040%), Immigrants from Peru (12.0%, a difference of 0.040%), Ethiopian (12.0%, a difference of 0.10%), Tohono O'odham (12.0%, a difference of 0.16%), and German Russian (12.0%, a difference of 0.21%). Similarly, the demographic groups most similar to Immigrants from Portugal are Czech (11.9%, a difference of 0.040%), Immigrants from Hungary (11.9%, a difference of 0.17%), Austrian (12.0%, a difference of 0.24%), Chilean (12.0%, a difference of 0.27%), and Japanese (12.0%, a difference of 0.29%).
| Demographics | Rating | Rank | Divorced or Separated |
| Immigrants | Portugal | 77.3 /100 | #150 | Good 11.9% |
| Czechs | 76.4 /100 | #151 | Good 11.9% |
| Immigrants | Hungary | 73.7 /100 | #152 | Good 11.9% |
| Austrians | 72.2 /100 | #153 | Good 12.0% |
| Chileans | 71.3 /100 | #154 | Good 12.0% |
| Japanese | 70.9 /100 | #155 | Good 12.0% |
| Hungarians | 70.3 /100 | #156 | Good 12.0% |
| Immigrants | Brazil | 68.8 /100 | #157 | Good 12.0% |
| Icelanders | 66.0 /100 | #158 | Good 12.0% |
| Immigrants | Barbados | 66.0 /100 | #159 | Good 12.0% |
| Immigrants | Scotland | 65.8 /100 | #160 | Good 12.0% |
| Marshallese | 64.6 /100 | #161 | Good 12.0% |
| Samoans | 64.3 /100 | #162 | Good 12.0% |
| Navajo | 63.9 /100 | #163 | Good 12.0% |
| Swiss | 63.6 /100 | #164 | Good 12.0% |
| German Russians | 61.8 /100 | #165 | Good 12.0% |
| Tohono O'odham | 60.4 /100 | #166 | Good 12.0% |
| Ethiopians | 58.5 /100 | #167 | Average 12.0% |
| Serbians | 57.1 /100 | #168 | Average 12.0% |
| Immigrants | Peru | 57.0 /100 | #169 | Average 12.0% |
| Mexican American Indians | 55.8 /100 | #170 | Average 12.0% |