Immigrants from Sri Lanka vs Marshallese Single Mother Households
COMPARE
Immigrants from Sri Lanka
Marshallese
Single Mother Households
Single Mother Households Comparison
Immigrants from Sri Lanka
Marshallese
5.6%
SINGLE MOTHER HOUSEHOLDS
98.0/ 100
METRIC RATING
79th/ 347
METRIC RANK
6.3%
SINGLE MOTHER HOUSEHOLDS
45.8/ 100
METRIC RATING
175th/ 347
METRIC RANK
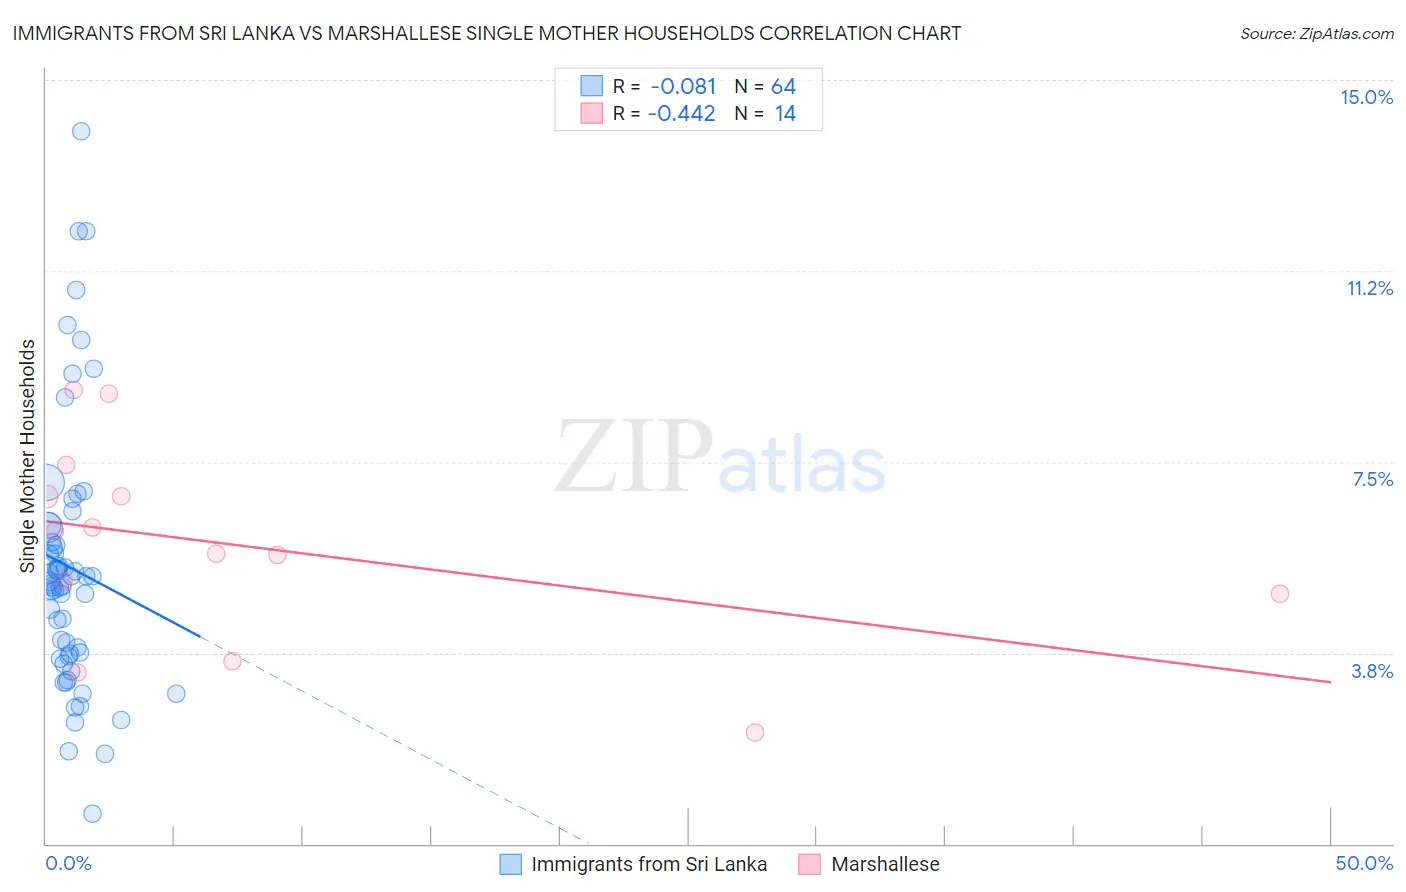
Immigrants from Sri Lanka vs Marshallese Single Mother Households Correlation Chart
The statistical analysis conducted on geographies consisting of 149,613,913 people shows a slight negative correlation between the proportion of Immigrants from Sri Lanka and percentage of single mother households in the United States with a correlation coefficient (R) of -0.081 and weighted average of 5.6%. Similarly, the statistical analysis conducted on geographies consisting of 14,758,592 people shows a moderate negative correlation between the proportion of Marshallese and percentage of single mother households in the United States with a correlation coefficient (R) of -0.442 and weighted average of 6.3%, a difference of 12.4%.
Single Mother Households Correlation Summary
| Measurement | Immigrants from Sri Lanka | Marshallese |
| Minimum | 0.60% | 2.2% |
| Maximum | 14.0% | 8.9% |
| Range | 13.4% | 6.7% |
| Mean | 5.4% | 5.8% |
| Median | 5.1% | 5.9% |
| Interquartile 25% (IQ1) | 3.7% | 4.9% |
| Interquartile 75% (IQ3) | 6.1% | 6.8% |
| Interquartile Range (IQR) | 2.4% | 1.9% |
| Standard Deviation (Sample) | 2.6% | 1.9% |
| Standard Deviation (Population) | 2.6% | 1.9% |
Similar Demographics by Single Mother Households
Demographics Similar to Immigrants from Sri Lanka by Single Mother Households
In terms of single mother households, the demographic groups most similar to Immigrants from Sri Lanka are Czech (5.6%, a difference of 0.11%), Immigrants from Moldova (5.6%, a difference of 0.11%), Swiss (5.6%, a difference of 0.20%), Romanian (5.6%, a difference of 0.21%), and Immigrants from Malaysia (5.7%, a difference of 0.32%).
| Demographics | Rating | Rank | Single Mother Households |
| Immigrants | Netherlands | 98.4 /100 | #72 | Exceptional 5.6% |
| Immigrants | Asia | 98.4 /100 | #73 | Exceptional 5.6% |
| Immigrants | North America | 98.3 /100 | #74 | Exceptional 5.6% |
| Slovenes | 98.3 /100 | #75 | Exceptional 5.6% |
| New Zealanders | 98.2 /100 | #76 | Exceptional 5.6% |
| Romanians | 98.1 /100 | #77 | Exceptional 5.6% |
| Swiss | 98.1 /100 | #78 | Exceptional 5.6% |
| Immigrants | Sri Lanka | 98.0 /100 | #79 | Exceptional 5.6% |
| Czechs | 97.9 /100 | #80 | Exceptional 5.6% |
| Immigrants | Moldova | 97.9 /100 | #81 | Exceptional 5.6% |
| Immigrants | Malaysia | 97.8 /100 | #82 | Exceptional 5.7% |
| Immigrants | Hungary | 97.8 /100 | #83 | Exceptional 5.7% |
| Carpatho Rusyns | 97.7 /100 | #84 | Exceptional 5.7% |
| Hungarians | 97.6 /100 | #85 | Exceptional 5.7% |
| Finns | 97.6 /100 | #86 | Exceptional 5.7% |
Demographics Similar to Marshallese by Single Mother Households
In terms of single mother households, the demographic groups most similar to Marshallese are Immigrants from Bosnia and Herzegovina (6.3%, a difference of 0.16%), Osage (6.4%, a difference of 0.30%), Immigrants from Morocco (6.3%, a difference of 0.46%), Immigrants from Vietnam (6.3%, a difference of 0.63%), and Portuguese (6.4%, a difference of 0.65%).
| Demographics | Rating | Rank | Single Mother Households |
| Immigrants | Chile | 58.3 /100 | #168 | Average 6.3% |
| Puget Sound Salish | 58.1 /100 | #169 | Average 6.3% |
| Immigrants | Oceania | 54.6 /100 | #170 | Average 6.3% |
| Afghans | 52.5 /100 | #171 | Average 6.3% |
| Immigrants | South Eastern Asia | 52.2 /100 | #172 | Average 6.3% |
| Immigrants | Vietnam | 51.5 /100 | #173 | Average 6.3% |
| Immigrants | Morocco | 50.0 /100 | #174 | Average 6.3% |
| Marshallese | 45.8 /100 | #175 | Average 6.3% |
| Immigrants | Bosnia and Herzegovina | 44.3 /100 | #176 | Average 6.3% |
| Osage | 43.0 /100 | #177 | Average 6.4% |
| Portuguese | 40.0 /100 | #178 | Fair 6.4% |
| Hmong | 39.8 /100 | #179 | Fair 6.4% |
| Immigrants | Nepal | 36.1 /100 | #180 | Fair 6.4% |
| Spanish | 33.4 /100 | #181 | Fair 6.4% |
| South American Indians | 33.4 /100 | #182 | Fair 6.4% |