Menominee vs Yaqui Currently Married
COMPARE
Menominee
Yaqui
Currently Married
Currently Married Comparison
Menominee
Yaqui
42.3%
CURRENTLY MARRIED
0.0/ 100
METRIC RATING
296th/ 347
METRIC RANK
43.4%
CURRENTLY MARRIED
0.1/ 100
METRIC RATING
273rd/ 347
METRIC RANK
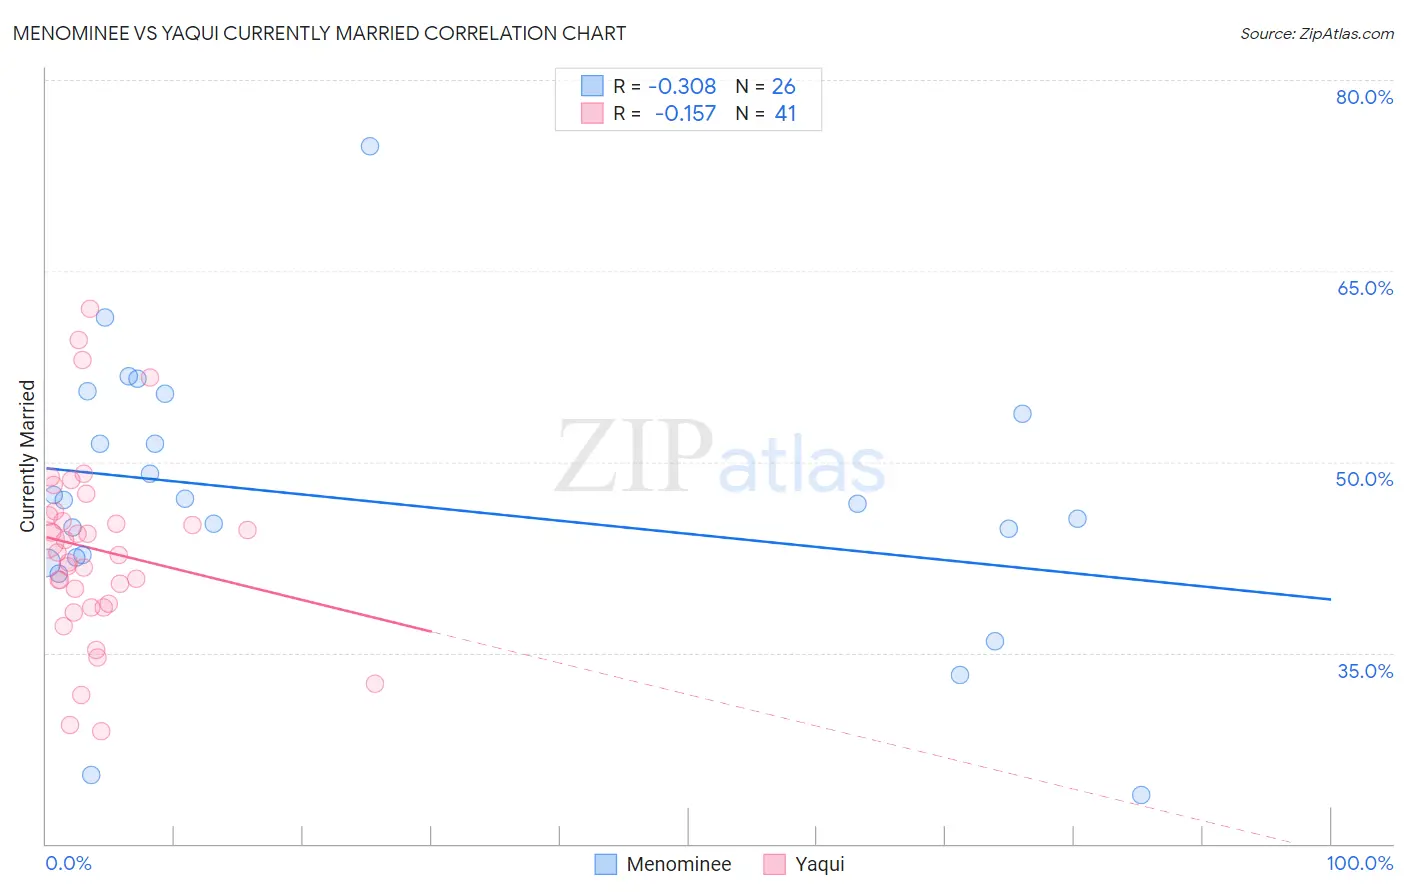
Menominee vs Yaqui Currently Married Correlation Chart
The statistical analysis conducted on geographies consisting of 45,778,979 people shows a mild negative correlation between the proportion of Menominee and percentage of population currently married in the United States with a correlation coefficient (R) of -0.308 and weighted average of 42.3%. Similarly, the statistical analysis conducted on geographies consisting of 107,738,640 people shows a poor negative correlation between the proportion of Yaqui and percentage of population currently married in the United States with a correlation coefficient (R) of -0.157 and weighted average of 43.4%, a difference of 2.7%.
Currently Married Correlation Summary
| Measurement | Menominee | Yaqui |
| Minimum | 23.8% | 28.9% |
| Maximum | 74.8% | 62.0% |
| Range | 51.0% | 33.1% |
| Mean | 47.0% | 43.1% |
| Median | 46.8% | 42.9% |
| Interquartile 25% (IQ1) | 42.5% | 38.7% |
| Interquartile 75% (IQ3) | 53.8% | 45.9% |
| Interquartile Range (IQR) | 11.3% | 7.2% |
| Standard Deviation (Sample) | 10.6% | 7.3% |
| Standard Deviation (Population) | 10.4% | 7.2% |
Similar Demographics by Currently Married
Demographics Similar to Menominee by Currently Married
In terms of currently married, the demographic groups most similar to Menominee are Cheyenne (42.2%, a difference of 0.11%), Immigrants from Honduras (42.2%, a difference of 0.20%), Immigrants from Western Africa (42.4%, a difference of 0.21%), Liberian (42.2%, a difference of 0.23%), and Belizean (42.2%, a difference of 0.33%).
| Demographics | Rating | Rank | Currently Married |
| Paiute | 0.0 /100 | #289 | Tragic 42.7% |
| Immigrants | Ghana | 0.0 /100 | #290 | Tragic 42.7% |
| Immigrants | Guatemala | 0.0 /100 | #291 | Tragic 42.6% |
| Sub-Saharan Africans | 0.0 /100 | #292 | Tragic 42.6% |
| Yuman | 0.0 /100 | #293 | Tragic 42.6% |
| Hondurans | 0.0 /100 | #294 | Tragic 42.5% |
| Immigrants | Western Africa | 0.0 /100 | #295 | Tragic 42.4% |
| Menominee | 0.0 /100 | #296 | Tragic 42.3% |
| Cheyenne | 0.0 /100 | #297 | Tragic 42.2% |
| Immigrants | Honduras | 0.0 /100 | #298 | Tragic 42.2% |
| Liberians | 0.0 /100 | #299 | Tragic 42.2% |
| Belizeans | 0.0 /100 | #300 | Tragic 42.2% |
| Immigrants | Yemen | 0.0 /100 | #301 | Tragic 42.1% |
| Immigrants | Zaire | 0.0 /100 | #302 | Tragic 42.0% |
| Sioux | 0.0 /100 | #303 | Tragic 41.9% |
Demographics Similar to Yaqui by Currently Married
In terms of currently married, the demographic groups most similar to Yaqui are Nigerian (43.4%, a difference of 0.020%), Indonesian (43.5%, a difference of 0.040%), Colville (43.4%, a difference of 0.040%), Sierra Leonean (43.4%, a difference of 0.070%), and Immigrants from Nigeria (43.4%, a difference of 0.070%).
| Demographics | Rating | Rank | Currently Married |
| Ecuadorians | 0.1 /100 | #266 | Tragic 43.6% |
| Immigrants | Eritrea | 0.1 /100 | #267 | Tragic 43.6% |
| Spanish American Indians | 0.1 /100 | #268 | Tragic 43.6% |
| Immigrants | Sudan | 0.1 /100 | #269 | Tragic 43.5% |
| Salvadorans | 0.1 /100 | #270 | Tragic 43.5% |
| Bermudans | 0.1 /100 | #271 | Tragic 43.5% |
| Indonesians | 0.1 /100 | #272 | Tragic 43.5% |
| Yaqui | 0.1 /100 | #273 | Tragic 43.4% |
| Nigerians | 0.1 /100 | #274 | Tragic 43.4% |
| Colville | 0.1 /100 | #275 | Tragic 43.4% |
| Sierra Leoneans | 0.1 /100 | #276 | Tragic 43.4% |
| Immigrants | Nigeria | 0.1 /100 | #277 | Tragic 43.4% |
| Central Americans | 0.0 /100 | #278 | Tragic 43.3% |
| Central American Indians | 0.0 /100 | #279 | Tragic 43.3% |
| Apache | 0.0 /100 | #280 | Tragic 43.2% |