Marshallese vs Immigrants from Syria Married-couple Households
COMPARE
Marshallese
Immigrants from Syria
Married-couple Households
Married-couple Households Comparison
Marshallese
Immigrants from Syria
44.6%
MARRIED-COUPLE HOUSEHOLDS
1.5/ 100
METRIC RATING
232nd/ 347
METRIC RANK
47.1%
MARRIED-COUPLE HOUSEHOLDS
81.6/ 100
METRIC RATING
147th/ 347
METRIC RANK
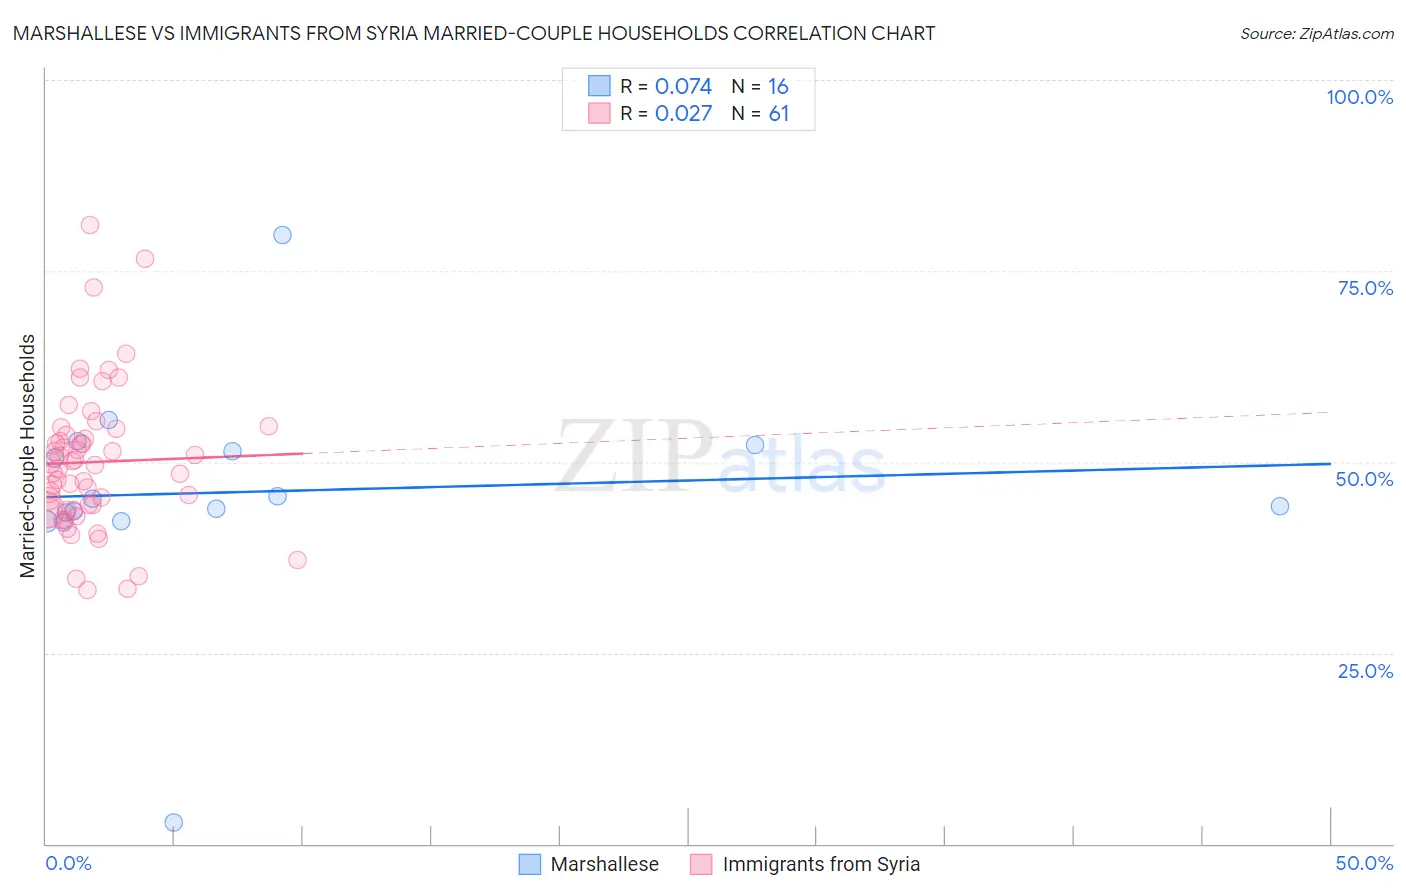
Marshallese vs Immigrants from Syria Married-couple Households Correlation Chart
The statistical analysis conducted on geographies consisting of 14,761,315 people shows a slight positive correlation between the proportion of Marshallese and percentage of married-couple family households in the United States with a correlation coefficient (R) of 0.074 and weighted average of 44.6%. Similarly, the statistical analysis conducted on geographies consisting of 174,106,206 people shows no correlation between the proportion of Immigrants from Syria and percentage of married-couple family households in the United States with a correlation coefficient (R) of 0.027 and weighted average of 47.1%, a difference of 5.5%.
Married-couple Households Correlation Summary
| Measurement | Marshallese | Immigrants from Syria |
| Minimum | 2.9% | 33.2% |
| Maximum | 79.7% | 81.0% |
| Range | 76.9% | 47.8% |
| Mean | 46.1% | 50.0% |
| Median | 44.7% | 49.5% |
| Interquartile 25% (IQ1) | 42.8% | 43.7% |
| Interquartile 75% (IQ3) | 51.8% | 53.9% |
| Interquartile Range (IQR) | 9.0% | 10.2% |
| Standard Deviation (Sample) | 14.8% | 9.4% |
| Standard Deviation (Population) | 14.3% | 9.4% |
Similar Demographics by Married-couple Households
Demographics Similar to Marshallese by Married-couple Households
In terms of married-couple households, the demographic groups most similar to Marshallese are Houma (44.6%, a difference of 0.0%), Soviet Union (44.6%, a difference of 0.010%), Immigrants from Uganda (44.6%, a difference of 0.040%), Immigrants from Latin America (44.7%, a difference of 0.050%), and Kenyan (44.7%, a difference of 0.10%).
| Demographics | Rating | Rank | Married-couple Households |
| Dutch West Indians | 2.6 /100 | #225 | Tragic 44.9% |
| Alsatians | 2.3 /100 | #226 | Tragic 44.8% |
| Salvadorans | 1.9 /100 | #227 | Tragic 44.7% |
| Kenyans | 1.7 /100 | #228 | Tragic 44.7% |
| Immigrants | Latin America | 1.6 /100 | #229 | Tragic 44.7% |
| Soviet Union | 1.6 /100 | #230 | Tragic 44.6% |
| Houma | 1.5 /100 | #231 | Tragic 44.6% |
| Marshallese | 1.5 /100 | #232 | Tragic 44.6% |
| Immigrants | Uganda | 1.5 /100 | #233 | Tragic 44.6% |
| Immigrants | Panama | 1.3 /100 | #234 | Tragic 44.6% |
| Immigrants | Nicaragua | 1.2 /100 | #235 | Tragic 44.5% |
| Yaqui | 1.2 /100 | #236 | Tragic 44.5% |
| Comanche | 1.2 /100 | #237 | Tragic 44.5% |
| Immigrants | Uruguay | 1.1 /100 | #238 | Tragic 44.5% |
| Spanish Americans | 1.1 /100 | #239 | Tragic 44.5% |
Demographics Similar to Immigrants from Syria by Married-couple Households
In terms of married-couple households, the demographic groups most similar to Immigrants from Syria are Immigrants from Western Europe (47.1%, a difference of 0.0%), Slovene (47.1%, a difference of 0.010%), Mexican (47.1%, a difference of 0.12%), Icelander (47.0%, a difference of 0.12%), and Immigrants from Belarus (47.2%, a difference of 0.14%).
| Demographics | Rating | Rank | Married-couple Households |
| Spanish | 84.5 /100 | #140 | Excellent 47.2% |
| Costa Ricans | 84.4 /100 | #141 | Excellent 47.2% |
| Spaniards | 84.1 /100 | #142 | Excellent 47.2% |
| Immigrants | Belarus | 83.8 /100 | #143 | Excellent 47.2% |
| Mexicans | 83.4 /100 | #144 | Excellent 47.1% |
| Slovenes | 81.7 /100 | #145 | Excellent 47.1% |
| Immigrants | Western Europe | 81.6 /100 | #146 | Excellent 47.1% |
| Immigrants | Syria | 81.6 /100 | #147 | Excellent 47.1% |
| Icelanders | 79.5 /100 | #148 | Good 47.0% |
| Paraguayans | 78.7 /100 | #149 | Good 47.0% |
| Immigrants | Russia | 77.6 /100 | #150 | Good 47.0% |
| Immigrants | Bulgaria | 76.8 /100 | #151 | Good 47.0% |
| Serbians | 76.3 /100 | #152 | Good 47.0% |
| Hmong | 76.2 /100 | #153 | Good 47.0% |
| Immigrants | Western Asia | 76.1 /100 | #154 | Good 46.9% |