Marshallese vs Immigrants from Latin America Average Family Size
COMPARE
Marshallese
Immigrants from Latin America
Average Family Size
Average Family Size Comparison
Marshallese
Immigrants from Latin America
3.38
AVERAGE FAMILY SIZE
100.0/ 100
METRIC RATING
41st/ 347
METRIC RANK
3.42
AVERAGE FAMILY SIZE
100.0/ 100
METRIC RATING
28th/ 347
METRIC RANK
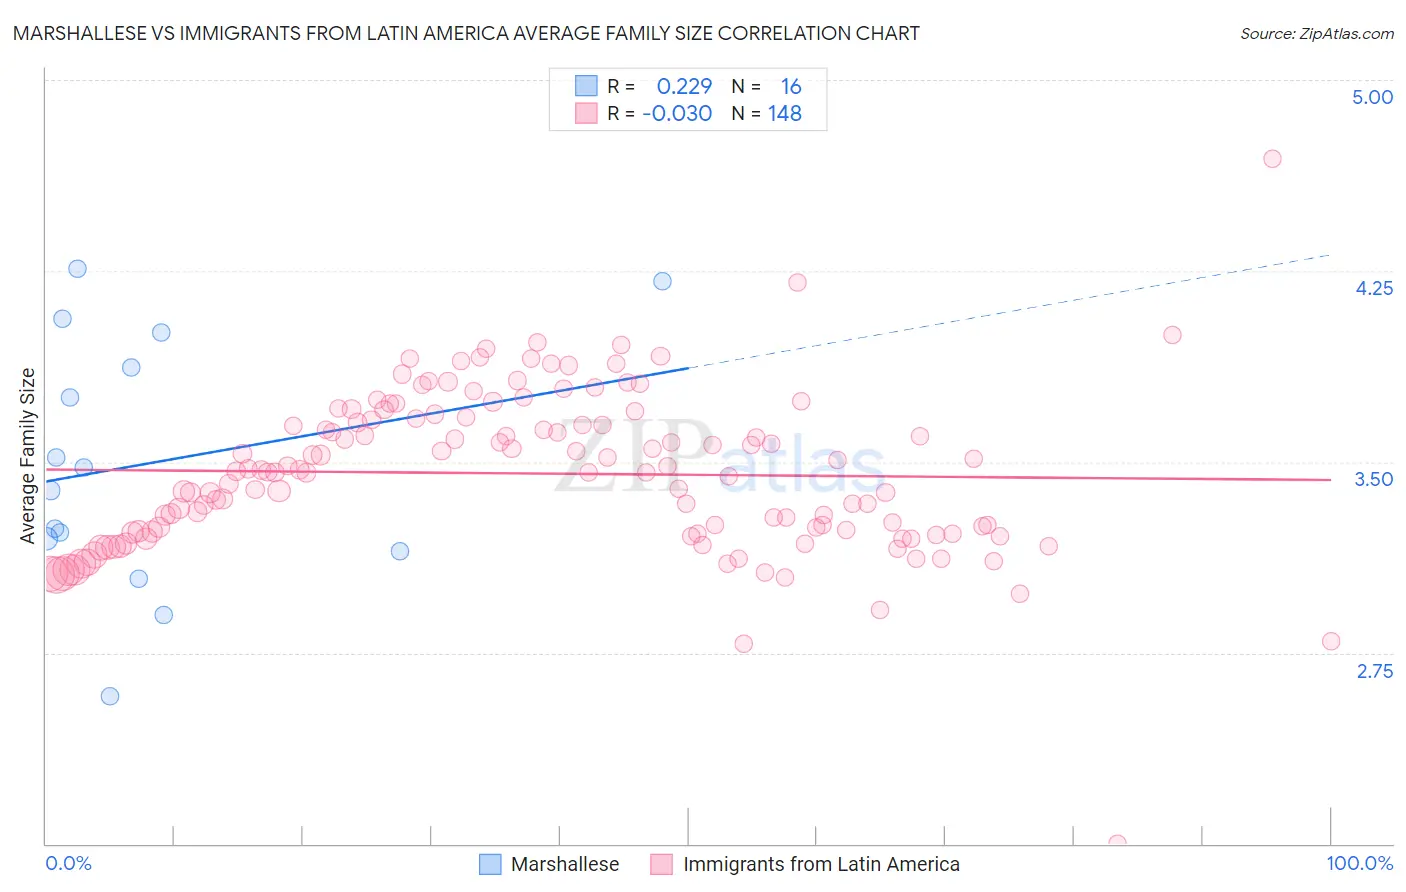
Marshallese vs Immigrants from Latin America Average Family Size Correlation Chart
The statistical analysis conducted on geographies consisting of 14,761,315 people shows a weak positive correlation between the proportion of Marshallese and average family size in the United States with a correlation coefficient (R) of 0.229 and weighted average of 3.38. Similarly, the statistical analysis conducted on geographies consisting of 558,036,591 people shows no correlation between the proportion of Immigrants from Latin America and average family size in the United States with a correlation coefficient (R) of -0.030 and weighted average of 3.42, a difference of 1.3%.
Average Family Size Correlation Summary
| Measurement | Marshallese | Immigrants from Latin America |
| Minimum | 2.58 | 2.00 |
| Maximum | 4.26 | 4.69 |
| Range | 1.68 | 2.69 |
| Mean | 3.49 | 3.45 |
| Median | 3.43 | 3.46 |
| Interquartile 25% (IQ1) | 3.17 | 3.22 |
| Interquartile 75% (IQ3) | 3.94 | 3.67 |
| Interquartile Range (IQR) | 0.76 | 0.45 |
| Standard Deviation (Sample) | 0.49 | 0.32 |
| Standard Deviation (Population) | 0.48 | 0.32 |
Demographics Similar to Marshallese and Immigrants from Latin America by Average Family Size
In terms of average family size, the demographic groups most similar to Marshallese are Immigrants from Vietnam (3.38, a difference of 0.060%), Immigrants from Philippines (3.37, a difference of 0.16%), Belizean (3.39, a difference of 0.17%), Alaska Native (3.37, a difference of 0.17%), and Immigrants from Haiti (3.39, a difference of 0.29%). Similarly, the demographic groups most similar to Immigrants from Latin America are Nepalese (3.42, a difference of 0.090%), Mexican American Indian (3.43, a difference of 0.12%), Samoan (3.42, a difference of 0.12%), Native Hawaiian (3.43, a difference of 0.13%), and Central American (3.41, a difference of 0.32%).
| Demographics | Rating | Rank | Average Family Size |
| Natives/Alaskans | 100.0 /100 | #24 | Exceptional 3.45 |
| Yakama | 100.0 /100 | #25 | Exceptional 3.45 |
| Native Hawaiians | 100.0 /100 | #26 | Exceptional 3.43 |
| Mexican American Indians | 100.0 /100 | #27 | Exceptional 3.43 |
| Immigrants | Latin America | 100.0 /100 | #28 | Exceptional 3.42 |
| Nepalese | 100.0 /100 | #29 | Exceptional 3.42 |
| Samoans | 100.0 /100 | #30 | Exceptional 3.42 |
| Central Americans | 100.0 /100 | #31 | Exceptional 3.41 |
| Immigrants | Guatemala | 100.0 /100 | #32 | Exceptional 3.41 |
| Hawaiians | 100.0 /100 | #33 | Exceptional 3.41 |
| Hispanics or Latinos | 100.0 /100 | #34 | Exceptional 3.41 |
| Guatemalans | 100.0 /100 | #35 | Exceptional 3.40 |
| Immigrants | Guyana | 100.0 /100 | #36 | Exceptional 3.40 |
| Guyanese | 100.0 /100 | #37 | Exceptional 3.40 |
| Immigrants | Belize | 100.0 /100 | #38 | Exceptional 3.39 |
| Immigrants | Haiti | 100.0 /100 | #39 | Exceptional 3.39 |
| Belizeans | 100.0 /100 | #40 | Exceptional 3.39 |
| Marshallese | 100.0 /100 | #41 | Exceptional 3.38 |
| Immigrants | Vietnam | 100.0 /100 | #42 | Exceptional 3.38 |
| Immigrants | Philippines | 100.0 /100 | #43 | Exceptional 3.37 |
| Alaska Natives | 100.0 /100 | #44 | Exceptional 3.37 |