Burmese vs Immigrants from Indonesia Single Father Households
COMPARE
Burmese
Immigrants from Indonesia
Single Father Households
Single Father Households Comparison
Burmese
Immigrants from Indonesia
2.0%
SINGLE FATHER HOUSEHOLDS
99.9/ 100
METRIC RATING
57th/ 347
METRIC RANK
2.2%
SINGLE FATHER HOUSEHOLDS
97.4/ 100
METRIC RATING
125th/ 347
METRIC RANK
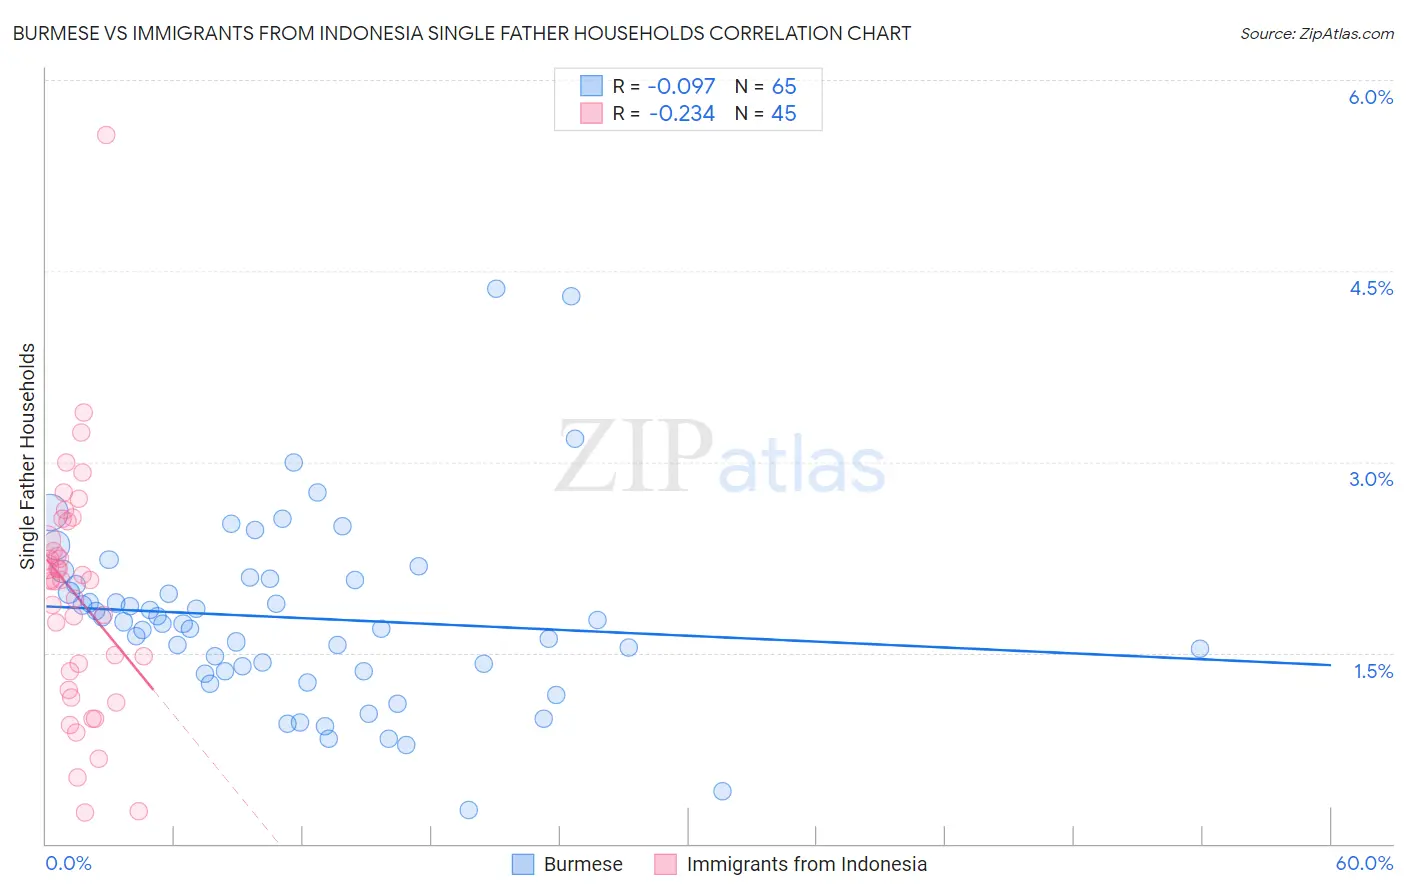
Burmese vs Immigrants from Indonesia Single Father Households Correlation Chart
The statistical analysis conducted on geographies consisting of 460,084,605 people shows a slight negative correlation between the proportion of Burmese and percentage of single father households in the United States with a correlation coefficient (R) of -0.097 and weighted average of 2.0%. Similarly, the statistical analysis conducted on geographies consisting of 214,943,478 people shows a weak negative correlation between the proportion of Immigrants from Indonesia and percentage of single father households in the United States with a correlation coefficient (R) of -0.234 and weighted average of 2.2%, a difference of 7.4%.
Single Father Households Correlation Summary
| Measurement | Burmese | Immigrants from Indonesia |
| Minimum | 0.27% | 0.25% |
| Maximum | 4.4% | 5.6% |
| Range | 4.1% | 5.3% |
| Mean | 1.8% | 2.0% |
| Median | 1.7% | 2.1% |
| Interquartile 25% (IQ1) | 1.4% | 1.3% |
| Interquartile 75% (IQ3) | 2.1% | 2.5% |
| Interquartile Range (IQR) | 0.72% | 1.2% |
| Standard Deviation (Sample) | 0.74% | 0.94% |
| Standard Deviation (Population) | 0.73% | 0.93% |
Similar Demographics by Single Father Households
Demographics Similar to Burmese by Single Father Households
In terms of single father households, the demographic groups most similar to Burmese are Immigrants from Czechoslovakia (2.0%, a difference of 0.020%), Immigrants from North Macedonia (2.0%, a difference of 0.13%), Immigrants from Austria (2.0%, a difference of 0.14%), Immigrants from Norway (2.0%, a difference of 0.26%), and Immigrants from France (2.0%, a difference of 0.29%).
| Demographics | Rating | Rank | Single Father Households |
| Immigrants | Switzerland | 99.9 /100 | #50 | Exceptional 2.0% |
| Immigrants | Poland | 99.9 /100 | #51 | Exceptional 2.0% |
| Immigrants | Europe | 99.9 /100 | #52 | Exceptional 2.0% |
| Immigrants | Northern Europe | 99.9 /100 | #53 | Exceptional 2.0% |
| Immigrants | Korea | 99.9 /100 | #54 | Exceptional 2.0% |
| Immigrants | France | 99.9 /100 | #55 | Exceptional 2.0% |
| Immigrants | Norway | 99.9 /100 | #56 | Exceptional 2.0% |
| Burmese | 99.9 /100 | #57 | Exceptional 2.0% |
| Immigrants | Czechoslovakia | 99.9 /100 | #58 | Exceptional 2.0% |
| Immigrants | North Macedonia | 99.9 /100 | #59 | Exceptional 2.0% |
| Immigrants | Austria | 99.9 /100 | #60 | Exceptional 2.0% |
| Vietnamese | 99.9 /100 | #61 | Exceptional 2.0% |
| Immigrants | Malaysia | 99.9 /100 | #62 | Exceptional 2.0% |
| Maltese | 99.9 /100 | #63 | Exceptional 2.0% |
| Mongolians | 99.9 /100 | #64 | Exceptional 2.1% |
Demographics Similar to Immigrants from Indonesia by Single Father Households
In terms of single father households, the demographic groups most similar to Immigrants from Indonesia are British West Indian (2.2%, a difference of 0.050%), Immigrants from Yemen (2.2%, a difference of 0.070%), Immigrants from Iraq (2.2%, a difference of 0.22%), Moroccan (2.2%, a difference of 0.31%), and Jordanian (2.2%, a difference of 0.31%).
| Demographics | Rating | Rank | Single Father Households |
| Immigrants | Morocco | 97.8 /100 | #118 | Exceptional 2.2% |
| Trinidadians and Tobagonians | 97.8 /100 | #119 | Exceptional 2.2% |
| Australians | 97.7 /100 | #120 | Exceptional 2.2% |
| Immigrants | Brazil | 97.7 /100 | #121 | Exceptional 2.2% |
| Immigrants | Iraq | 97.6 /100 | #122 | Exceptional 2.2% |
| Immigrants | Yemen | 97.5 /100 | #123 | Exceptional 2.2% |
| British West Indians | 97.4 /100 | #124 | Exceptional 2.2% |
| Immigrants | Indonesia | 97.4 /100 | #125 | Exceptional 2.2% |
| Moroccans | 96.9 /100 | #126 | Exceptional 2.2% |
| Jordanians | 96.9 /100 | #127 | Exceptional 2.2% |
| Immigrants | England | 96.8 /100 | #128 | Exceptional 2.2% |
| Serbians | 96.8 /100 | #129 | Exceptional 2.2% |
| Immigrants | Chile | 96.7 /100 | #130 | Exceptional 2.2% |
| Immigrants | Jordan | 96.6 /100 | #131 | Exceptional 2.2% |
| Poles | 96.5 /100 | #132 | Exceptional 2.2% |