Haitian vs Immigrants from Indonesia Single Father Households
COMPARE
Haitian
Immigrants from Indonesia
Single Father Households
Single Father Households Comparison
Haitians
Immigrants from Indonesia
2.6%
SINGLE FATHER HOUSEHOLDS
0.4/ 100
METRIC RATING
268th/ 347
METRIC RANK
2.2%
SINGLE FATHER HOUSEHOLDS
97.4/ 100
METRIC RATING
125th/ 347
METRIC RANK
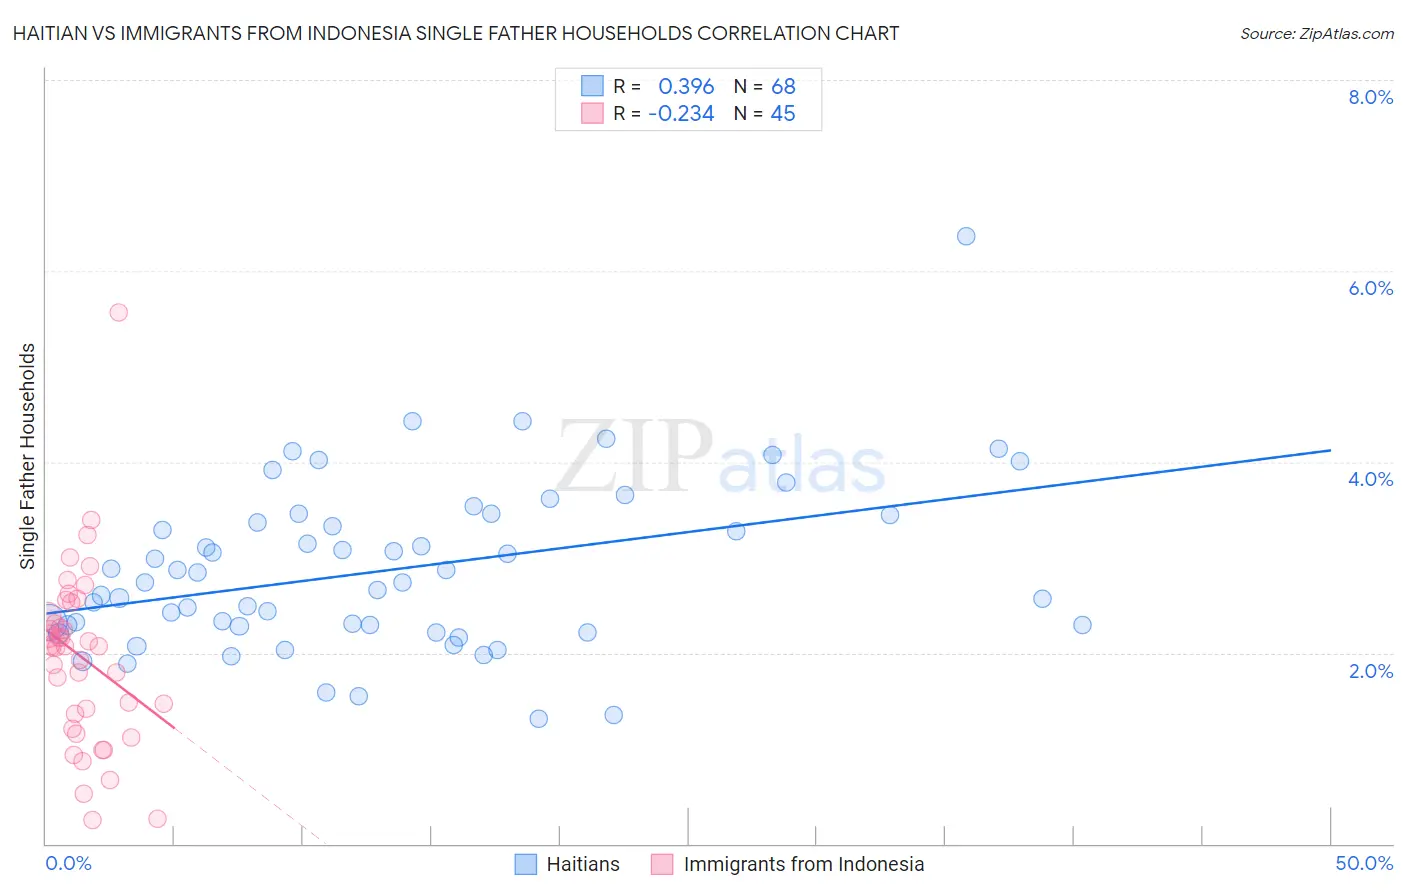
Haitian vs Immigrants from Indonesia Single Father Households Correlation Chart
The statistical analysis conducted on geographies consisting of 285,939,112 people shows a mild positive correlation between the proportion of Haitians and percentage of single father households in the United States with a correlation coefficient (R) of 0.396 and weighted average of 2.6%. Similarly, the statistical analysis conducted on geographies consisting of 214,943,478 people shows a weak negative correlation between the proportion of Immigrants from Indonesia and percentage of single father households in the United States with a correlation coefficient (R) of -0.234 and weighted average of 2.2%, a difference of 18.2%.
Single Father Households Correlation Summary
| Measurement | Haitian | Immigrants from Indonesia |
| Minimum | 1.3% | 0.25% |
| Maximum | 6.4% | 5.6% |
| Range | 5.1% | 5.3% |
| Mean | 2.9% | 2.0% |
| Median | 2.7% | 2.1% |
| Interquartile 25% (IQ1) | 2.3% | 1.3% |
| Interquartile 75% (IQ3) | 3.4% | 2.5% |
| Interquartile Range (IQR) | 1.1% | 1.2% |
| Standard Deviation (Sample) | 0.88% | 0.94% |
| Standard Deviation (Population) | 0.87% | 0.93% |
Similar Demographics by Single Father Households
Demographics Similar to Haitians by Single Father Households
In terms of single father households, the demographic groups most similar to Haitians are Guamanian/Chamorro (2.6%, a difference of 0.040%), Cuban (2.6%, a difference of 0.34%), Seminole (2.6%, a difference of 0.48%), French American Indian (2.6%, a difference of 0.52%), and Immigrants from Micronesia (2.6%, a difference of 0.56%).
| Demographics | Rating | Rank | Single Father Households |
| Immigrants | Belize | 0.9 /100 | #261 | Tragic 2.5% |
| Immigrants | Liberia | 0.8 /100 | #262 | Tragic 2.5% |
| Dominicans | 0.8 /100 | #263 | Tragic 2.5% |
| Indonesians | 0.5 /100 | #264 | Tragic 2.6% |
| Immigrants | Micronesia | 0.5 /100 | #265 | Tragic 2.6% |
| French American Indians | 0.5 /100 | #266 | Tragic 2.6% |
| Guamanians/Chamorros | 0.4 /100 | #267 | Tragic 2.6% |
| Haitians | 0.4 /100 | #268 | Tragic 2.6% |
| Cubans | 0.3 /100 | #269 | Tragic 2.6% |
| Seminole | 0.3 /100 | #270 | Tragic 2.6% |
| Creek | 0.2 /100 | #271 | Tragic 2.6% |
| Belizeans | 0.2 /100 | #272 | Tragic 2.6% |
| Iroquois | 0.2 /100 | #273 | Tragic 2.6% |
| Puerto Ricans | 0.2 /100 | #274 | Tragic 2.6% |
| Immigrants | Dominican Republic | 0.2 /100 | #275 | Tragic 2.6% |
Demographics Similar to Immigrants from Indonesia by Single Father Households
In terms of single father households, the demographic groups most similar to Immigrants from Indonesia are British West Indian (2.2%, a difference of 0.050%), Immigrants from Yemen (2.2%, a difference of 0.070%), Immigrants from Iraq (2.2%, a difference of 0.22%), Moroccan (2.2%, a difference of 0.31%), and Jordanian (2.2%, a difference of 0.31%).
| Demographics | Rating | Rank | Single Father Households |
| Immigrants | Morocco | 97.8 /100 | #118 | Exceptional 2.2% |
| Trinidadians and Tobagonians | 97.8 /100 | #119 | Exceptional 2.2% |
| Australians | 97.7 /100 | #120 | Exceptional 2.2% |
| Immigrants | Brazil | 97.7 /100 | #121 | Exceptional 2.2% |
| Immigrants | Iraq | 97.6 /100 | #122 | Exceptional 2.2% |
| Immigrants | Yemen | 97.5 /100 | #123 | Exceptional 2.2% |
| British West Indians | 97.4 /100 | #124 | Exceptional 2.2% |
| Immigrants | Indonesia | 97.4 /100 | #125 | Exceptional 2.2% |
| Moroccans | 96.9 /100 | #126 | Exceptional 2.2% |
| Jordanians | 96.9 /100 | #127 | Exceptional 2.2% |
| Immigrants | England | 96.8 /100 | #128 | Exceptional 2.2% |
| Serbians | 96.8 /100 | #129 | Exceptional 2.2% |
| Immigrants | Chile | 96.7 /100 | #130 | Exceptional 2.2% |
| Immigrants | Jordan | 96.6 /100 | #131 | Exceptional 2.2% |
| Poles | 96.5 /100 | #132 | Exceptional 2.2% |