Marshallese vs Immigrants from Indonesia In Labor Force | Age 16-19
COMPARE
Marshallese
Immigrants from Indonesia
In Labor Force | Age 16-19
In Labor Force | Age 16-19 Comparison
Marshallese
Immigrants from Indonesia
39.5%
IN LABOR FORCE | AGE 16-19
99.8/ 100
METRIC RATING
79th/ 347
METRIC RANK
33.5%
IN LABOR FORCE | AGE 16-19
0.1/ 100
METRIC RATING
288th/ 347
METRIC RANK
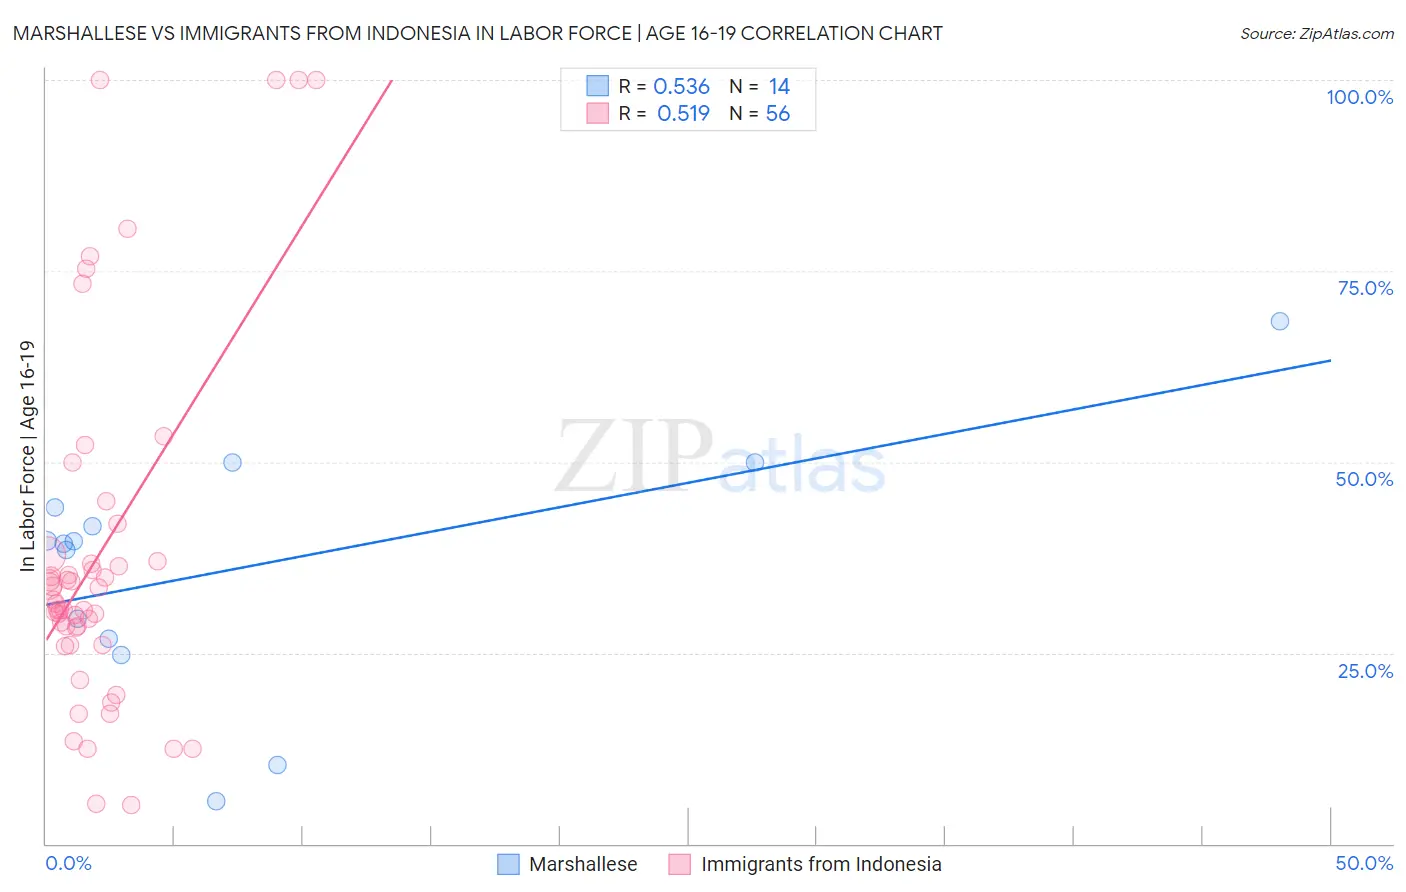
Marshallese vs Immigrants from Indonesia In Labor Force | Age 16-19 Correlation Chart
The statistical analysis conducted on geographies consisting of 14,757,218 people shows a substantial positive correlation between the proportion of Marshallese and labor force participation rate among population between the ages 16 and 19 in the United States with a correlation coefficient (R) of 0.536 and weighted average of 39.5%. Similarly, the statistical analysis conducted on geographies consisting of 215,635,356 people shows a substantial positive correlation between the proportion of Immigrants from Indonesia and labor force participation rate among population between the ages 16 and 19 in the United States with a correlation coefficient (R) of 0.519 and weighted average of 33.5%, a difference of 17.8%.
In Labor Force | Age 16-19 Correlation Summary
| Measurement | Marshallese | Immigrants from Indonesia |
| Minimum | 5.6% | 5.1% |
| Maximum | 68.4% | 100.0% |
| Range | 62.8% | 94.9% |
| Mean | 36.3% | 37.9% |
| Median | 39.5% | 31.7% |
| Interquartile 25% (IQ1) | 26.8% | 27.2% |
| Interquartile 75% (IQ3) | 44.1% | 37.4% |
| Interquartile Range (IQR) | 17.3% | 10.2% |
| Standard Deviation (Sample) | 16.2% | 23.4% |
| Standard Deviation (Population) | 15.6% | 23.2% |
Similar Demographics by In Labor Force | Age 16-19
Demographics Similar to Marshallese by In Labor Force | Age 16-19
In terms of in labor force | age 16-19, the demographic groups most similar to Marshallese are Austrian (39.5%, a difference of 0.13%), Immigrants from Iraq (39.4%, a difference of 0.18%), Shoshone (39.3%, a difference of 0.46%), Immigrants from Portugal (39.7%, a difference of 0.52%), and Basque (39.3%, a difference of 0.52%).
| Demographics | Rating | Rank | In Labor Force | Age 16-19 |
| Iroquois | 99.9 /100 | #72 | Exceptional 39.9% |
| Immigrants | Middle Africa | 99.9 /100 | #73 | Exceptional 39.9% |
| Hungarians | 99.9 /100 | #74 | Exceptional 39.8% |
| French American Indians | 99.9 /100 | #75 | Exceptional 39.8% |
| Malaysians | 99.9 /100 | #76 | Exceptional 39.7% |
| Immigrants | Portugal | 99.9 /100 | #77 | Exceptional 39.7% |
| Austrians | 99.8 /100 | #78 | Exceptional 39.5% |
| Marshallese | 99.8 /100 | #79 | Exceptional 39.5% |
| Immigrants | Iraq | 99.8 /100 | #80 | Exceptional 39.4% |
| Shoshone | 99.7 /100 | #81 | Exceptional 39.3% |
| Basques | 99.7 /100 | #82 | Exceptional 39.3% |
| Spanish | 99.7 /100 | #83 | Exceptional 39.3% |
| Immigrants | Uganda | 99.7 /100 | #84 | Exceptional 39.2% |
| Creek | 99.6 /100 | #85 | Exceptional 39.1% |
| Samoans | 99.6 /100 | #86 | Exceptional 39.1% |
Demographics Similar to Immigrants from Indonesia by In Labor Force | Age 16-19
In terms of in labor force | age 16-19, the demographic groups most similar to Immigrants from Indonesia are Immigrants from Singapore (33.5%, a difference of 0.0%), Nepalese (33.5%, a difference of 0.040%), Immigrants from Colombia (33.5%, a difference of 0.14%), Immigrants from Belarus (33.4%, a difference of 0.22%), and South American (33.6%, a difference of 0.27%).
| Demographics | Rating | Rank | In Labor Force | Age 16-19 |
| Cypriots | 0.3 /100 | #281 | Tragic 33.8% |
| Immigrants | Korea | 0.3 /100 | #282 | Tragic 33.8% |
| Immigrants | Venezuela | 0.2 /100 | #283 | Tragic 33.7% |
| Immigrants | Spain | 0.2 /100 | #284 | Tragic 33.7% |
| U.S. Virgin Islanders | 0.2 /100 | #285 | Tragic 33.6% |
| South Americans | 0.2 /100 | #286 | Tragic 33.6% |
| Nepalese | 0.1 /100 | #287 | Tragic 33.5% |
| Immigrants | Indonesia | 0.1 /100 | #288 | Tragic 33.5% |
| Immigrants | Singapore | 0.1 /100 | #289 | Tragic 33.5% |
| Immigrants | Colombia | 0.1 /100 | #290 | Tragic 33.5% |
| Immigrants | Belarus | 0.1 /100 | #291 | Tragic 33.4% |
| Haitians | 0.1 /100 | #292 | Tragic 33.4% |
| Immigrants | South America | 0.1 /100 | #293 | Tragic 33.3% |
| Argentineans | 0.1 /100 | #294 | Tragic 33.3% |
| Yup'ik | 0.1 /100 | #295 | Tragic 33.3% |