Yaqui vs Hmong Divorced or Separated
COMPARE
Yaqui
Hmong
Divorced or Separated
Divorced or Separated Comparison
Yaqui
Hmong
13.3%
DIVORCED OR SEPARATED
0.0/ 100
METRIC RATING
314th/ 347
METRIC RANK
12.3%
DIVORCED OR SEPARATED
8.8/ 100
METRIC RATING
227th/ 347
METRIC RANK
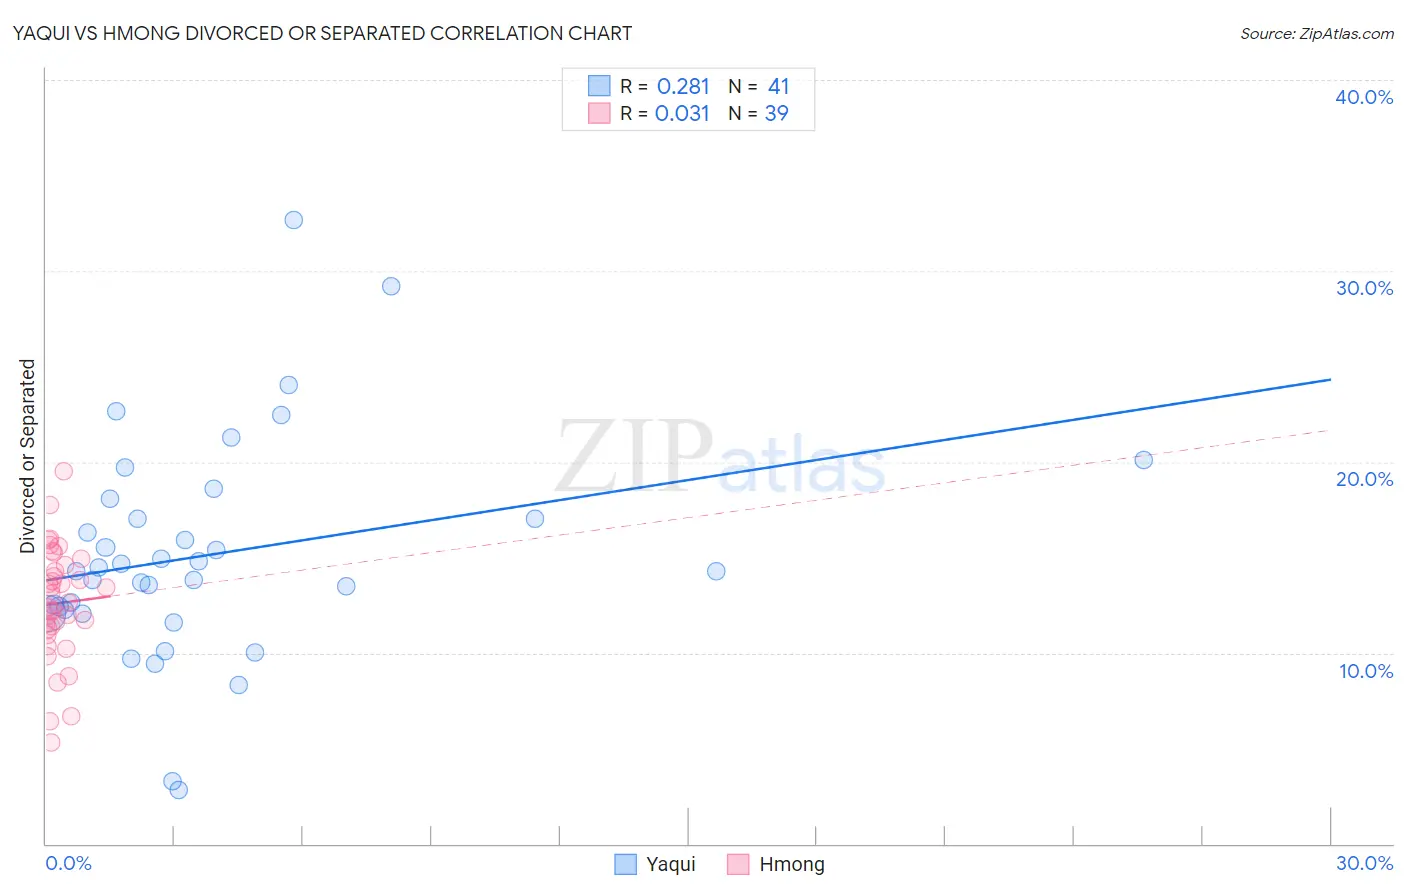
Yaqui vs Hmong Divorced or Separated Correlation Chart
The statistical analysis conducted on geographies consisting of 107,734,723 people shows a weak positive correlation between the proportion of Yaqui and percentage of population currently divorced or separated in the United States with a correlation coefficient (R) of 0.281 and weighted average of 13.3%. Similarly, the statistical analysis conducted on geographies consisting of 24,678,157 people shows no correlation between the proportion of Hmong and percentage of population currently divorced or separated in the United States with a correlation coefficient (R) of 0.031 and weighted average of 12.3%, a difference of 8.2%.
Divorced or Separated Correlation Summary
| Measurement | Yaqui | Hmong |
| Minimum | 2.8% | 5.3% |
| Maximum | 32.7% | 19.5% |
| Range | 29.9% | 14.2% |
| Mean | 15.1% | 12.6% |
| Median | 14.3% | 12.6% |
| Interquartile 25% (IQ1) | 12.2% | 11.3% |
| Interquartile 75% (IQ3) | 17.5% | 14.6% |
| Interquartile Range (IQR) | 5.4% | 3.3% |
| Standard Deviation (Sample) | 5.8% | 3.0% |
| Standard Deviation (Population) | 5.7% | 2.9% |
Similar Demographics by Divorced or Separated
Demographics Similar to Yaqui by Divorced or Separated
In terms of divorced or separated, the demographic groups most similar to Yaqui are Immigrants from Nicaragua (13.3%, a difference of 0.010%), Blackfeet (13.3%, a difference of 0.21%), Spanish American (13.3%, a difference of 0.23%), Tsimshian (13.3%, a difference of 0.26%), and Haitian (13.3%, a difference of 0.28%).
| Demographics | Rating | Rank | Divorced or Separated |
| French American Indians | 0.0 /100 | #307 | Tragic 13.2% |
| Ottawa | 0.0 /100 | #308 | Tragic 13.2% |
| Americans | 0.0 /100 | #309 | Tragic 13.2% |
| Africans | 0.0 /100 | #310 | Tragic 13.2% |
| Sioux | 0.0 /100 | #311 | Tragic 13.2% |
| Blackfeet | 0.0 /100 | #312 | Tragic 13.3% |
| Immigrants | Nicaragua | 0.0 /100 | #313 | Tragic 13.3% |
| Yaqui | 0.0 /100 | #314 | Tragic 13.3% |
| Spanish Americans | 0.0 /100 | #315 | Tragic 13.3% |
| Tsimshian | 0.0 /100 | #316 | Tragic 13.3% |
| Haitians | 0.0 /100 | #317 | Tragic 13.3% |
| Cree | 0.0 /100 | #318 | Tragic 13.4% |
| Puget Sound Salish | 0.0 /100 | #319 | Tragic 13.4% |
| Cajuns | 0.0 /100 | #320 | Tragic 13.4% |
| Cheyenne | 0.0 /100 | #321 | Tragic 13.4% |
Demographics Similar to Hmong by Divorced or Separated
In terms of divorced or separated, the demographic groups most similar to Hmong are Immigrants from Western Africa (12.3%, a difference of 0.050%), Immigrants from Cameroon (12.3%, a difference of 0.050%), Immigrants from Sudan (12.3%, a difference of 0.070%), Immigrants from the Azores (12.3%, a difference of 0.090%), and Belgian (12.3%, a difference of 0.090%).
| Demographics | Rating | Rank | Divorced or Separated |
| British | 11.6 /100 | #220 | Poor 12.3% |
| Guamanians/Chamorros | 11.3 /100 | #221 | Poor 12.3% |
| Bangladeshis | 10.5 /100 | #222 | Poor 12.3% |
| Scandinavians | 10.4 /100 | #223 | Poor 12.3% |
| Immigrants | Azores | 9.7 /100 | #224 | Tragic 12.3% |
| Belgians | 9.7 /100 | #225 | Tragic 12.3% |
| Immigrants | Western Africa | 9.3 /100 | #226 | Tragic 12.3% |
| Hmong | 8.8 /100 | #227 | Tragic 12.3% |
| Immigrants | Cameroon | 8.3 /100 | #228 | Tragic 12.3% |
| Immigrants | Sudan | 8.2 /100 | #229 | Tragic 12.3% |
| Yakama | 7.8 /100 | #230 | Tragic 12.3% |
| Yugoslavians | 6.6 /100 | #231 | Tragic 12.3% |
| Canadians | 5.3 /100 | #232 | Tragic 12.4% |
| Malaysians | 4.8 /100 | #233 | Tragic 12.4% |
| West Indians | 4.4 /100 | #234 | Tragic 12.4% |