Marshallese vs Hmong 1st Grade
COMPARE
Marshallese
Hmong
1st Grade
1st Grade Comparison
Marshallese
Hmong
98.0%
1ST GRADE
82.0/ 100
METRIC RATING
142nd/ 347
METRIC RANK
98.0%
1ST GRADE
79.0/ 100
METRIC RATING
145th/ 347
METRIC RANK
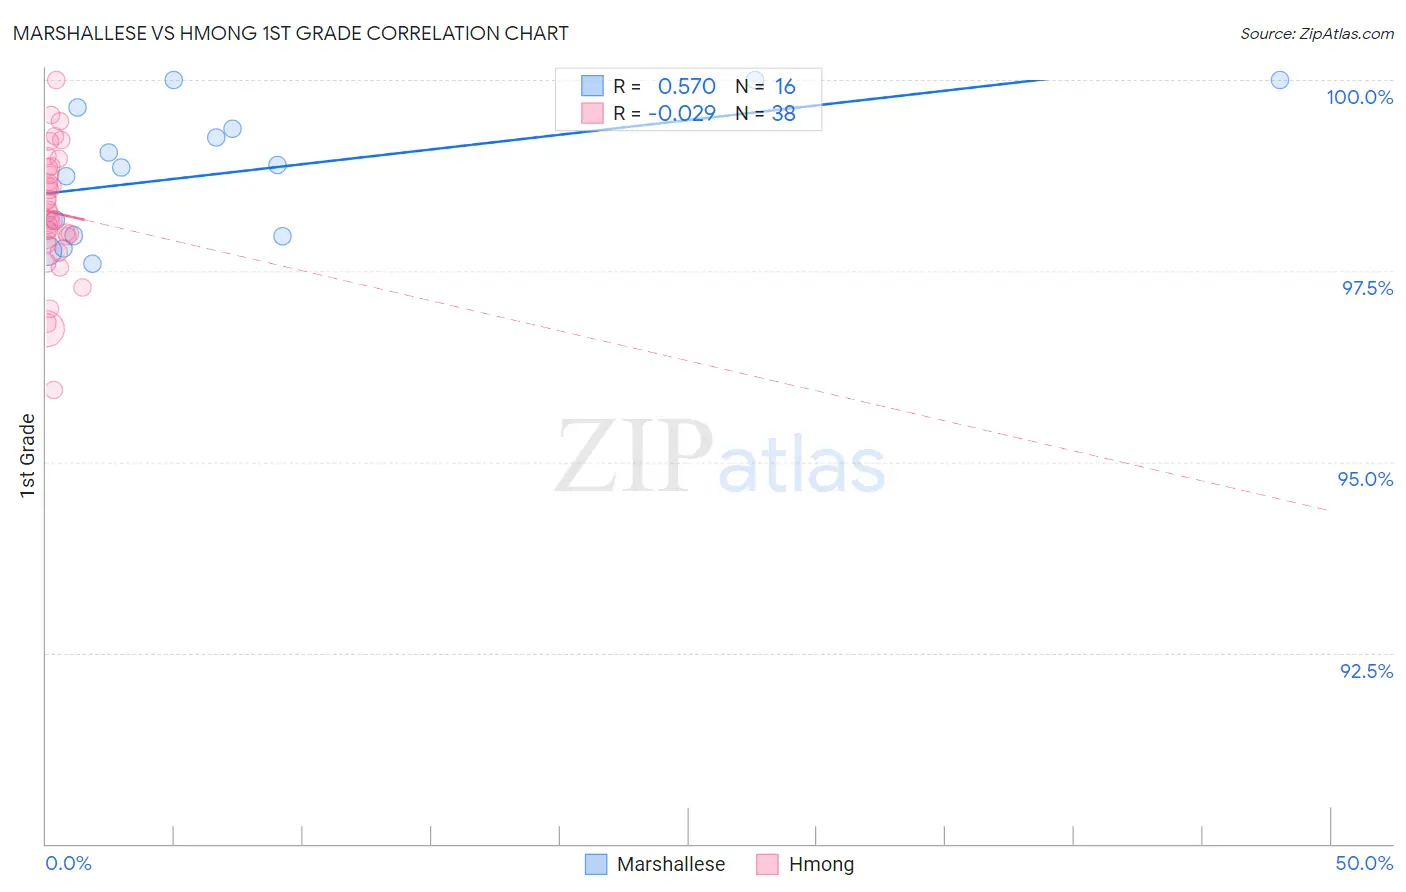
Marshallese vs Hmong 1st Grade Correlation Chart
The statistical analysis conducted on geographies consisting of 14,761,315 people shows a substantial positive correlation between the proportion of Marshallese and percentage of population with at least 1st grade education in the United States with a correlation coefficient (R) of 0.570 and weighted average of 98.0%. Similarly, the statistical analysis conducted on geographies consisting of 24,672,093 people shows no correlation between the proportion of Hmong and percentage of population with at least 1st grade education in the United States with a correlation coefficient (R) of -0.029 and weighted average of 98.0%, a difference of 0.010%.
1st Grade Correlation Summary
| Measurement | Marshallese | Hmong |
| Minimum | 97.6% | 95.9% |
| Maximum | 100.0% | 100.0% |
| Range | 2.4% | 4.1% |
| Mean | 98.8% | 98.3% |
| Median | 98.9% | 98.2% |
| Interquartile 25% (IQ1) | 98.0% | 97.9% |
| Interquartile 75% (IQ3) | 99.5% | 98.9% |
| Interquartile Range (IQR) | 1.5% | 0.95% |
| Standard Deviation (Sample) | 0.86% | 0.83% |
| Standard Deviation (Population) | 0.83% | 0.82% |
Demographics Similar to Marshallese and Hmong by 1st Grade
In terms of 1st grade, the demographic groups most similar to Marshallese are Immigrants from Turkey (98.0%, a difference of 0.0%), Palestinian (98.0%, a difference of 0.010%), Burmese (98.0%, a difference of 0.010%), Alsatian (98.0%, a difference of 0.010%), and Immigrants from Israel (98.0%, a difference of 0.020%). Similarly, the demographic groups most similar to Hmong are Burmese (98.0%, a difference of 0.010%), Alsatian (98.0%, a difference of 0.010%), Immigrants from Israel (98.0%, a difference of 0.010%), Filipino (98.0%, a difference of 0.010%), and Palestinian (98.0%, a difference of 0.020%).
| Demographics | Rating | Rank | 1st Grade |
| Immigrants | Europe | 90.5 /100 | #133 | Exceptional 98.1% |
| Immigrants | Hungary | 89.4 /100 | #134 | Excellent 98.1% |
| Immigrants | Kuwait | 89.3 /100 | #135 | Excellent 98.1% |
| Immigrants | Bulgaria | 88.8 /100 | #136 | Excellent 98.1% |
| Israelis | 87.8 /100 | #137 | Excellent 98.1% |
| Immigrants | Romania | 87.8 /100 | #138 | Excellent 98.1% |
| Blackfeet | 87.6 /100 | #139 | Excellent 98.1% |
| Palestinians | 83.0 /100 | #140 | Excellent 98.0% |
| Immigrants | Turkey | 82.8 /100 | #141 | Excellent 98.0% |
| Marshallese | 82.0 /100 | #142 | Excellent 98.0% |
| Burmese | 81.0 /100 | #143 | Excellent 98.0% |
| Alsatians | 80.9 /100 | #144 | Excellent 98.0% |
| Hmong | 79.0 /100 | #145 | Good 98.0% |
| Immigrants | Israel | 77.8 /100 | #146 | Good 98.0% |
| Filipinos | 77.6 /100 | #147 | Good 98.0% |
| Apache | 75.2 /100 | #148 | Good 98.0% |
| Immigrants | Greece | 74.9 /100 | #149 | Good 98.0% |
| Jordanians | 72.7 /100 | #150 | Good 98.0% |
| Dutch West Indians | 69.8 /100 | #151 | Good 98.0% |
| Immigrants | Moldova | 69.5 /100 | #152 | Good 98.0% |
| Soviet Union | 68.9 /100 | #153 | Good 98.0% |