Laotian vs French Canadian Divorced or Separated
COMPARE
Laotian
French Canadian
Divorced or Separated
Divorced or Separated Comparison
Laotians
French Canadians
11.2%
DIVORCED OR SEPARATED
100.0/ 100
METRIC RATING
46th/ 347
METRIC RANK
12.8%
DIVORCED OR SEPARATED
0.1/ 100
METRIC RATING
288th/ 347
METRIC RANK
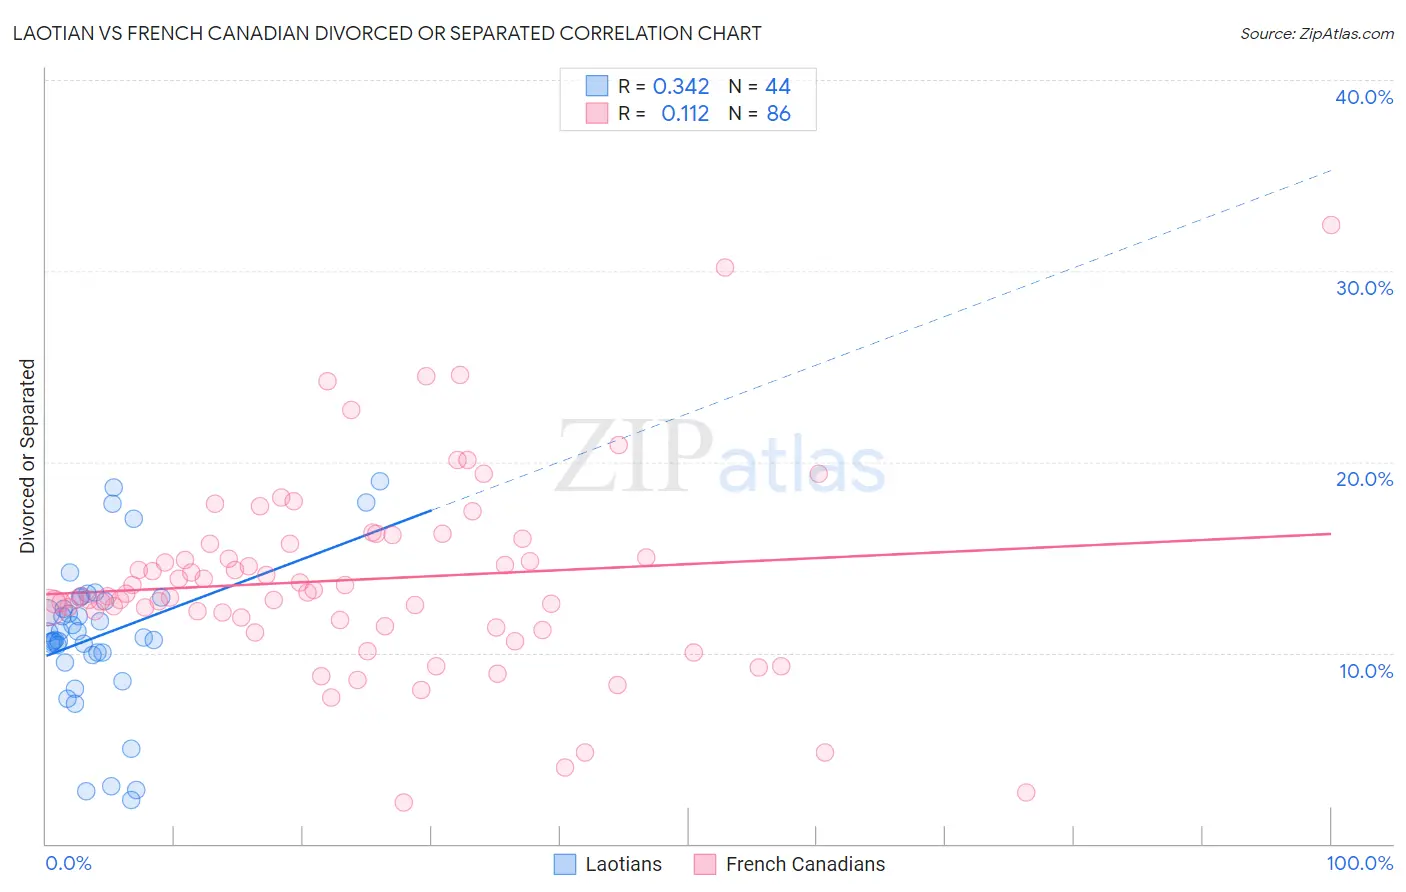
Laotian vs French Canadian Divorced or Separated Correlation Chart
The statistical analysis conducted on geographies consisting of 224,772,196 people shows a mild positive correlation between the proportion of Laotians and percentage of population currently divorced or separated in the United States with a correlation coefficient (R) of 0.342 and weighted average of 11.2%. Similarly, the statistical analysis conducted on geographies consisting of 502,403,685 people shows a poor positive correlation between the proportion of French Canadians and percentage of population currently divorced or separated in the United States with a correlation coefficient (R) of 0.112 and weighted average of 12.8%, a difference of 14.6%.
Divorced or Separated Correlation Summary
| Measurement | Laotian | French Canadian |
| Minimum | 2.3% | 2.2% |
| Maximum | 19.0% | 32.4% |
| Range | 16.7% | 30.2% |
| Mean | 10.9% | 13.8% |
| Median | 10.9% | 13.0% |
| Interquartile 25% (IQ1) | 9.9% | 11.7% |
| Interquartile 75% (IQ3) | 12.8% | 15.7% |
| Interquartile Range (IQR) | 2.9% | 4.0% |
| Standard Deviation (Sample) | 3.9% | 5.1% |
| Standard Deviation (Population) | 3.8% | 5.1% |
Similar Demographics by Divorced or Separated
Demographics Similar to Laotians by Divorced or Separated
In terms of divorced or separated, the demographic groups most similar to Laotians are Immigrants from Poland (11.2%, a difference of 0.010%), Immigrants from Turkey (11.2%, a difference of 0.040%), Immigrants from Saudi Arabia (11.2%, a difference of 0.050%), Turkish (11.2%, a difference of 0.11%), and Bolivian (11.2%, a difference of 0.12%).
| Demographics | Rating | Rank | Divorced or Separated |
| Immigrants | Egypt | 100.0 /100 | #39 | Exceptional 11.1% |
| Soviet Union | 100.0 /100 | #40 | Exceptional 11.1% |
| Bhutanese | 100.0 /100 | #41 | Exceptional 11.2% |
| Chinese | 100.0 /100 | #42 | Exceptional 11.2% |
| Immigrants | Belarus | 100.0 /100 | #43 | Exceptional 11.2% |
| Immigrants | Western Asia | 100.0 /100 | #44 | Exceptional 11.2% |
| Turks | 100.0 /100 | #45 | Exceptional 11.2% |
| Laotians | 100.0 /100 | #46 | Exceptional 11.2% |
| Immigrants | Poland | 100.0 /100 | #47 | Exceptional 11.2% |
| Immigrants | Turkey | 100.0 /100 | #48 | Exceptional 11.2% |
| Immigrants | Saudi Arabia | 100.0 /100 | #49 | Exceptional 11.2% |
| Bolivians | 100.0 /100 | #50 | Exceptional 11.2% |
| Immigrants | Bolivia | 100.0 /100 | #51 | Exceptional 11.3% |
| Immigrants | Australia | 99.9 /100 | #52 | Exceptional 11.3% |
| Immigrants | Lithuania | 99.9 /100 | #53 | Exceptional 11.3% |
Demographics Similar to French Canadians by Divorced or Separated
In terms of divorced or separated, the demographic groups most similar to French Canadians are Iroquois (12.9%, a difference of 0.15%), Honduran (12.8%, a difference of 0.26%), Pima (12.9%, a difference of 0.29%), Immigrants from Honduras (12.9%, a difference of 0.41%), and Spanish (12.8%, a difference of 0.45%).
| Demographics | Rating | Rank | Divorced or Separated |
| Pueblo | 0.2 /100 | #281 | Tragic 12.7% |
| Sub-Saharan Africans | 0.1 /100 | #282 | Tragic 12.7% |
| Delaware | 0.1 /100 | #283 | Tragic 12.7% |
| Immigrants | Nonimmigrants | 0.1 /100 | #284 | Tragic 12.8% |
| French | 0.1 /100 | #285 | Tragic 12.8% |
| Spanish | 0.1 /100 | #286 | Tragic 12.8% |
| Hondurans | 0.1 /100 | #287 | Tragic 12.8% |
| French Canadians | 0.1 /100 | #288 | Tragic 12.8% |
| Iroquois | 0.0 /100 | #289 | Tragic 12.9% |
| Pima | 0.0 /100 | #290 | Tragic 12.9% |
| Immigrants | Honduras | 0.0 /100 | #291 | Tragic 12.9% |
| Scotch-Irish | 0.0 /100 | #292 | Tragic 12.9% |
| Jamaicans | 0.0 /100 | #293 | Tragic 12.9% |
| Apache | 0.0 /100 | #294 | Tragic 12.9% |
| Celtics | 0.0 /100 | #295 | Tragic 13.0% |