Maltese vs Immigrants from Western Asia Currently Married
COMPARE
Maltese
Immigrants from Western Asia
Currently Married
Currently Married Comparison
Maltese
Immigrants from Western Asia
49.0%
CURRENTLY MARRIED
99.6/ 100
METRIC RATING
25th/ 347
METRIC RANK
46.9%
CURRENTLY MARRIED
64.2/ 100
METRIC RATING
164th/ 347
METRIC RANK
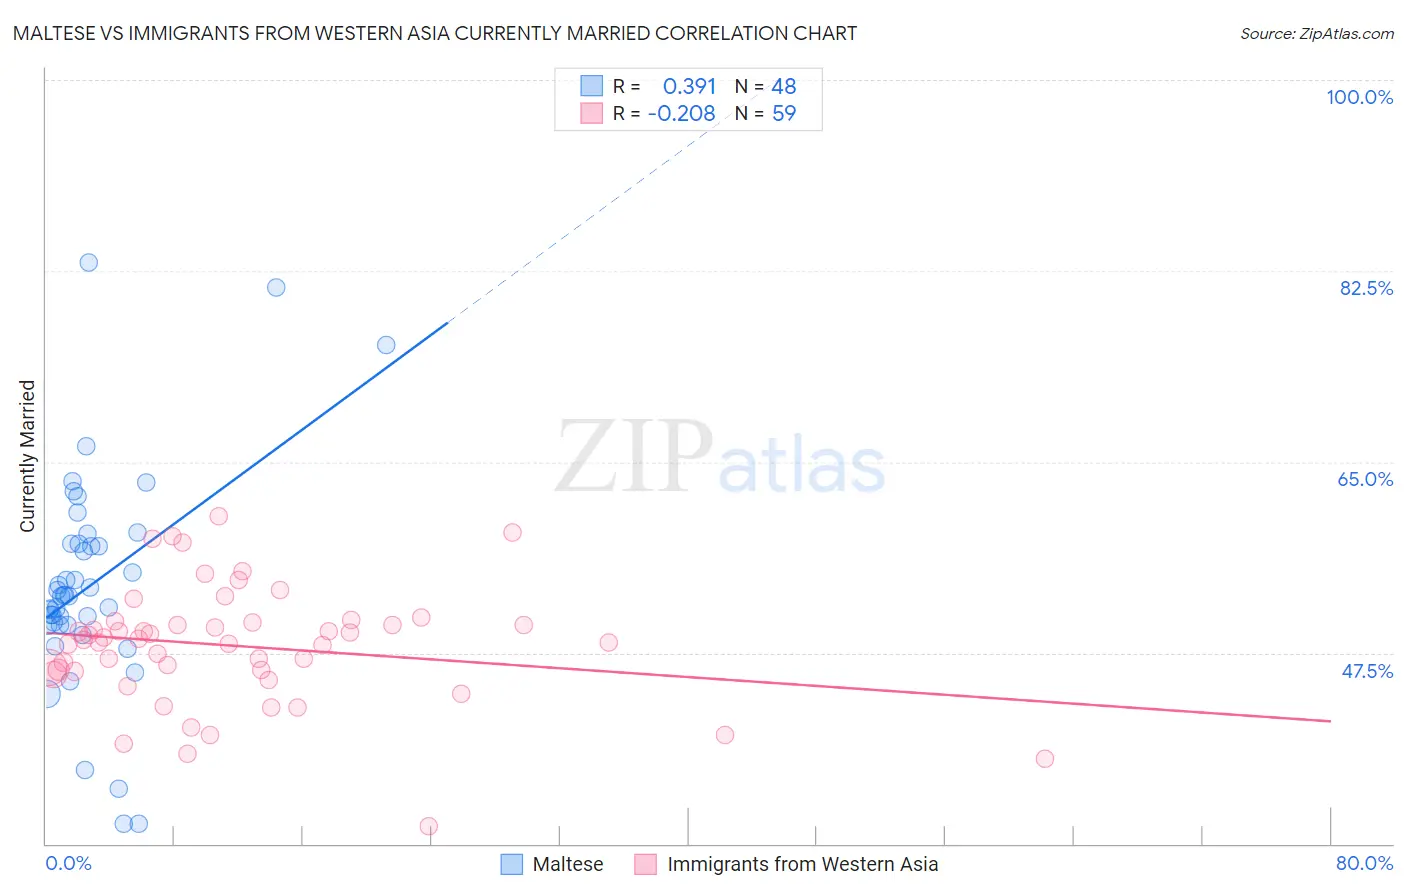
Maltese vs Immigrants from Western Asia Currently Married Correlation Chart
The statistical analysis conducted on geographies consisting of 126,466,050 people shows a mild positive correlation between the proportion of Maltese and percentage of population currently married in the United States with a correlation coefficient (R) of 0.391 and weighted average of 49.0%. Similarly, the statistical analysis conducted on geographies consisting of 404,387,767 people shows a weak negative correlation between the proportion of Immigrants from Western Asia and percentage of population currently married in the United States with a correlation coefficient (R) of -0.208 and weighted average of 46.9%, a difference of 4.5%.
Currently Married Correlation Summary
| Measurement | Maltese | Immigrants from Western Asia |
| Minimum | 31.8% | 31.6% |
| Maximum | 83.3% | 60.1% |
| Range | 51.5% | 28.5% |
| Mean | 53.8% | 48.1% |
| Median | 52.8% | 48.7% |
| Interquartile 25% (IQ1) | 50.0% | 45.8% |
| Interquartile 75% (IQ3) | 57.5% | 50.3% |
| Interquartile Range (IQR) | 7.5% | 4.5% |
| Standard Deviation (Sample) | 10.1% | 5.4% |
| Standard Deviation (Population) | 10.0% | 5.4% |
Similar Demographics by Currently Married
Demographics Similar to Maltese by Currently Married
In terms of currently married, the demographic groups most similar to Maltese are Lithuanian (49.0%, a difference of 0.010%), Immigrants from Korea (49.0%, a difference of 0.050%), Immigrants from Pakistan (49.1%, a difference of 0.12%), Burmese (48.9%, a difference of 0.12%), and Welsh (48.9%, a difference of 0.16%).
| Demographics | Rating | Rank | Currently Married |
| Immigrants | Scotland | 99.8 /100 | #18 | Exceptional 49.3% |
| Europeans | 99.8 /100 | #19 | Exceptional 49.3% |
| Luxembourgers | 99.8 /100 | #20 | Exceptional 49.3% |
| Scottish | 99.8 /100 | #21 | Exceptional 49.2% |
| Bulgarians | 99.7 /100 | #22 | Exceptional 49.1% |
| Immigrants | Pakistan | 99.7 /100 | #23 | Exceptional 49.1% |
| Lithuanians | 99.6 /100 | #24 | Exceptional 49.0% |
| Maltese | 99.6 /100 | #25 | Exceptional 49.0% |
| Immigrants | Korea | 99.6 /100 | #26 | Exceptional 49.0% |
| Burmese | 99.6 /100 | #27 | Exceptional 48.9% |
| Welsh | 99.5 /100 | #28 | Exceptional 48.9% |
| Croatians | 99.5 /100 | #29 | Exceptional 48.9% |
| Eastern Europeans | 99.5 /100 | #30 | Exceptional 48.9% |
| Poles | 99.5 /100 | #31 | Exceptional 48.9% |
| Immigrants | Hong Kong | 99.5 /100 | #32 | Exceptional 48.9% |
Demographics Similar to Immigrants from Western Asia by Currently Married
In terms of currently married, the demographic groups most similar to Immigrants from Western Asia are Delaware (46.9%, a difference of 0.020%), Nonimmigrants (46.9%, a difference of 0.050%), Immigrants from Uzbekistan (46.9%, a difference of 0.070%), Immigrants from Southern Europe (46.9%, a difference of 0.070%), and Iraqi (46.9%, a difference of 0.080%).
| Demographics | Rating | Rank | Currently Married |
| Immigrants | Switzerland | 67.8 /100 | #157 | Good 46.9% |
| Cherokee | 66.8 /100 | #158 | Good 46.9% |
| Iraqis | 66.4 /100 | #159 | Good 46.9% |
| Immigrants | Uzbekistan | 66.0 /100 | #160 | Good 46.9% |
| Immigrants | Southern Europe | 65.9 /100 | #161 | Good 46.9% |
| Immigrants | Nonimmigrants | 65.4 /100 | #162 | Good 46.9% |
| Delaware | 64.7 /100 | #163 | Good 46.9% |
| Immigrants | Western Asia | 64.2 /100 | #164 | Good 46.9% |
| Samoans | 59.8 /100 | #165 | Average 46.8% |
| Immigrants | Syria | 59.3 /100 | #166 | Average 46.8% |
| Spaniards | 58.8 /100 | #167 | Average 46.8% |
| Immigrants | Afghanistan | 58.2 /100 | #168 | Average 46.8% |
| Armenians | 58.2 /100 | #169 | Average 46.8% |
| Immigrants | Latvia | 56.7 /100 | #170 | Average 46.7% |
| Immigrants | Zimbabwe | 52.4 /100 | #171 | Average 46.7% |