Malaysian vs Liberian Single Mother Households
COMPARE
Malaysian
Liberian
Single Mother Households
Single Mother Households Comparison
Malaysians
Liberians
7.3%
SINGLE MOTHER HOUSEHOLDS
0.3/ 100
METRIC RATING
251st/ 347
METRIC RANK
8.6%
SINGLE MOTHER HOUSEHOLDS
0.0/ 100
METRIC RATING
333rd/ 347
METRIC RANK
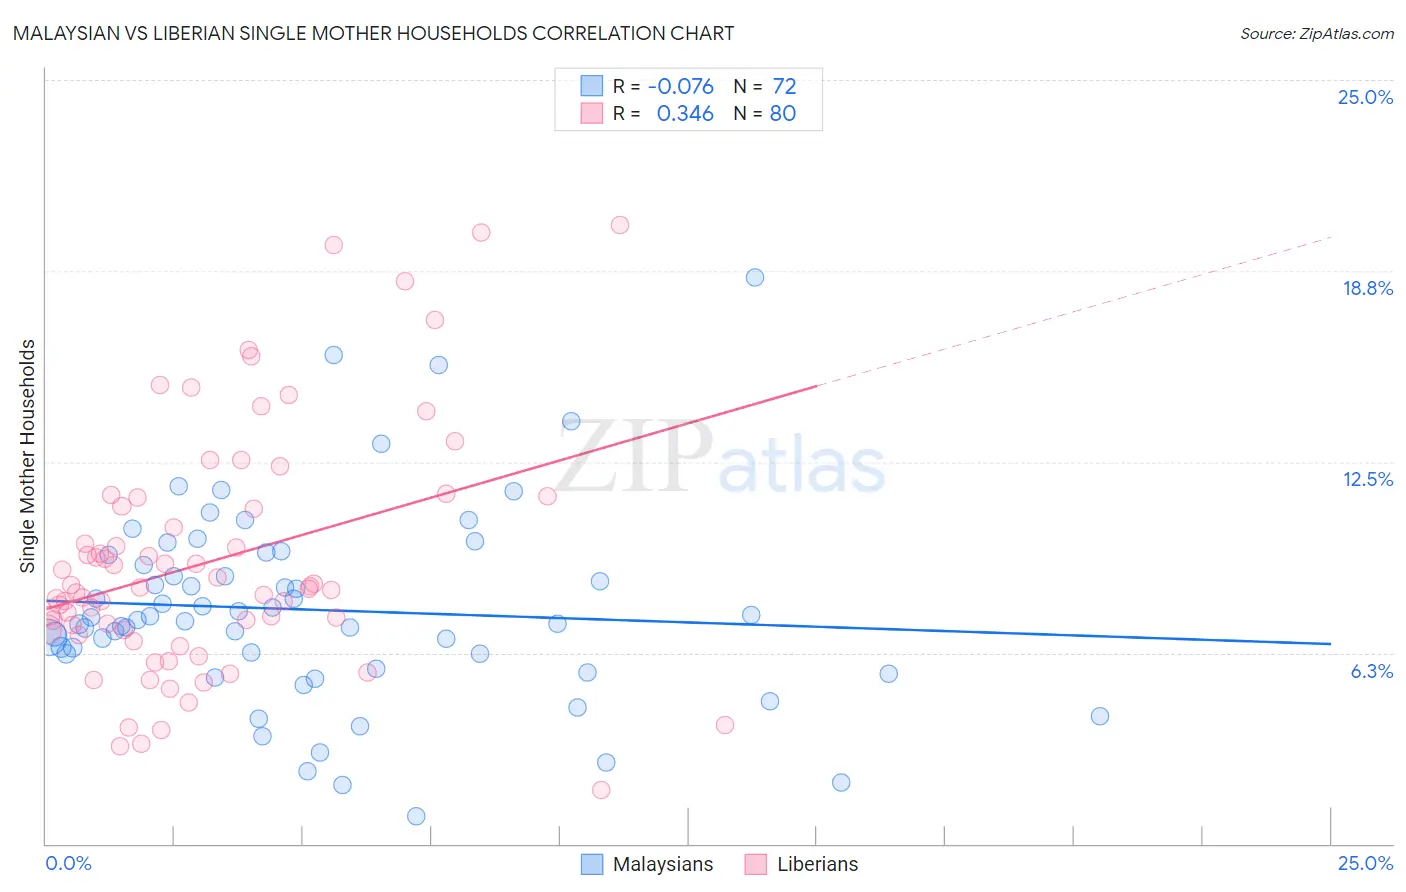
Malaysian vs Liberian Single Mother Households Correlation Chart
The statistical analysis conducted on geographies consisting of 225,856,339 people shows a slight negative correlation between the proportion of Malaysians and percentage of single mother households in the United States with a correlation coefficient (R) of -0.076 and weighted average of 7.3%. Similarly, the statistical analysis conducted on geographies consisting of 118,018,313 people shows a mild positive correlation between the proportion of Liberians and percentage of single mother households in the United States with a correlation coefficient (R) of 0.346 and weighted average of 8.6%, a difference of 18.3%.
Single Mother Households Correlation Summary
| Measurement | Malaysian | Liberian |
| Minimum | 0.92% | 1.7% |
| Maximum | 18.5% | 20.2% |
| Range | 17.6% | 18.5% |
| Mean | 7.7% | 9.3% |
| Median | 7.3% | 8.4% |
| Interquartile 25% (IQ1) | 6.0% | 7.0% |
| Interquartile 75% (IQ3) | 9.3% | 11.2% |
| Interquartile Range (IQR) | 3.3% | 4.2% |
| Standard Deviation (Sample) | 3.2% | 4.0% |
| Standard Deviation (Population) | 3.2% | 3.9% |
Similar Demographics by Single Mother Households
Demographics Similar to Malaysians by Single Mother Households
In terms of single mother households, the demographic groups most similar to Malaysians are Alaskan Athabascan (7.3%, a difference of 0.020%), Immigrants from Africa (7.3%, a difference of 0.34%), Bermudan (7.3%, a difference of 0.36%), Cajun (7.3%, a difference of 0.41%), and Immigrants from Ecuador (7.3%, a difference of 0.46%).
| Demographics | Rating | Rank | Single Mother Households |
| Cubans | 0.6 /100 | #244 | Tragic 7.2% |
| Immigrants | Cambodia | 0.5 /100 | #245 | Tragic 7.2% |
| Nicaraguans | 0.5 /100 | #246 | Tragic 7.2% |
| Dutch West Indians | 0.4 /100 | #247 | Tragic 7.3% |
| Spanish American Indians | 0.4 /100 | #248 | Tragic 7.3% |
| Bermudans | 0.4 /100 | #249 | Tragic 7.3% |
| Immigrants | Africa | 0.4 /100 | #250 | Tragic 7.3% |
| Malaysians | 0.3 /100 | #251 | Tragic 7.3% |
| Alaskan Athabascans | 0.3 /100 | #252 | Tragic 7.3% |
| Cajuns | 0.3 /100 | #253 | Tragic 7.3% |
| Immigrants | Ecuador | 0.3 /100 | #254 | Tragic 7.3% |
| Mexican American Indians | 0.2 /100 | #255 | Tragic 7.4% |
| Seminole | 0.2 /100 | #256 | Tragic 7.4% |
| Alaska Natives | 0.2 /100 | #257 | Tragic 7.4% |
| Pueblo | 0.2 /100 | #258 | Tragic 7.4% |
Demographics Similar to Liberians by Single Mother Households
In terms of single mother households, the demographic groups most similar to Liberians are U.S. Virgin Islander (8.6%, a difference of 0.33%), Immigrants from Liberia (8.7%, a difference of 0.80%), Immigrants from Dominica (8.7%, a difference of 1.1%), Puerto Rican (8.7%, a difference of 1.1%), and Inupiat (8.5%, a difference of 1.8%).
| Demographics | Rating | Rank | Single Mother Households |
| British West Indians | 0.0 /100 | #326 | Tragic 8.4% |
| Immigrants | Haiti | 0.0 /100 | #327 | Tragic 8.4% |
| Yakama | 0.0 /100 | #328 | Tragic 8.4% |
| Hopi | 0.0 /100 | #329 | Tragic 8.5% |
| Inupiat | 0.0 /100 | #330 | Tragic 8.5% |
| Sioux | 0.0 /100 | #331 | Tragic 8.5% |
| U.S. Virgin Islanders | 0.0 /100 | #332 | Tragic 8.6% |
| Liberians | 0.0 /100 | #333 | Tragic 8.6% |
| Immigrants | Liberia | 0.0 /100 | #334 | Tragic 8.7% |
| Immigrants | Dominica | 0.0 /100 | #335 | Tragic 8.7% |
| Puerto Ricans | 0.0 /100 | #336 | Tragic 8.7% |
| Navajo | 0.0 /100 | #337 | Tragic 8.8% |
| Cape Verdeans | 0.0 /100 | #338 | Tragic 8.9% |
| Blacks/African Americans | 0.0 /100 | #339 | Tragic 9.0% |
| Lumbee | 0.0 /100 | #340 | Tragic 9.1% |