Malaysian vs Argentinean Single Mother Households
COMPARE
Malaysian
Argentinean
Single Mother Households
Single Mother Households Comparison
Malaysians
Argentineans
7.3%
SINGLE MOTHER HOUSEHOLDS
0.3/ 100
METRIC RATING
251st/ 347
METRIC RANK
5.8%
SINGLE MOTHER HOUSEHOLDS
93.7/ 100
METRIC RATING
121st/ 347
METRIC RANK
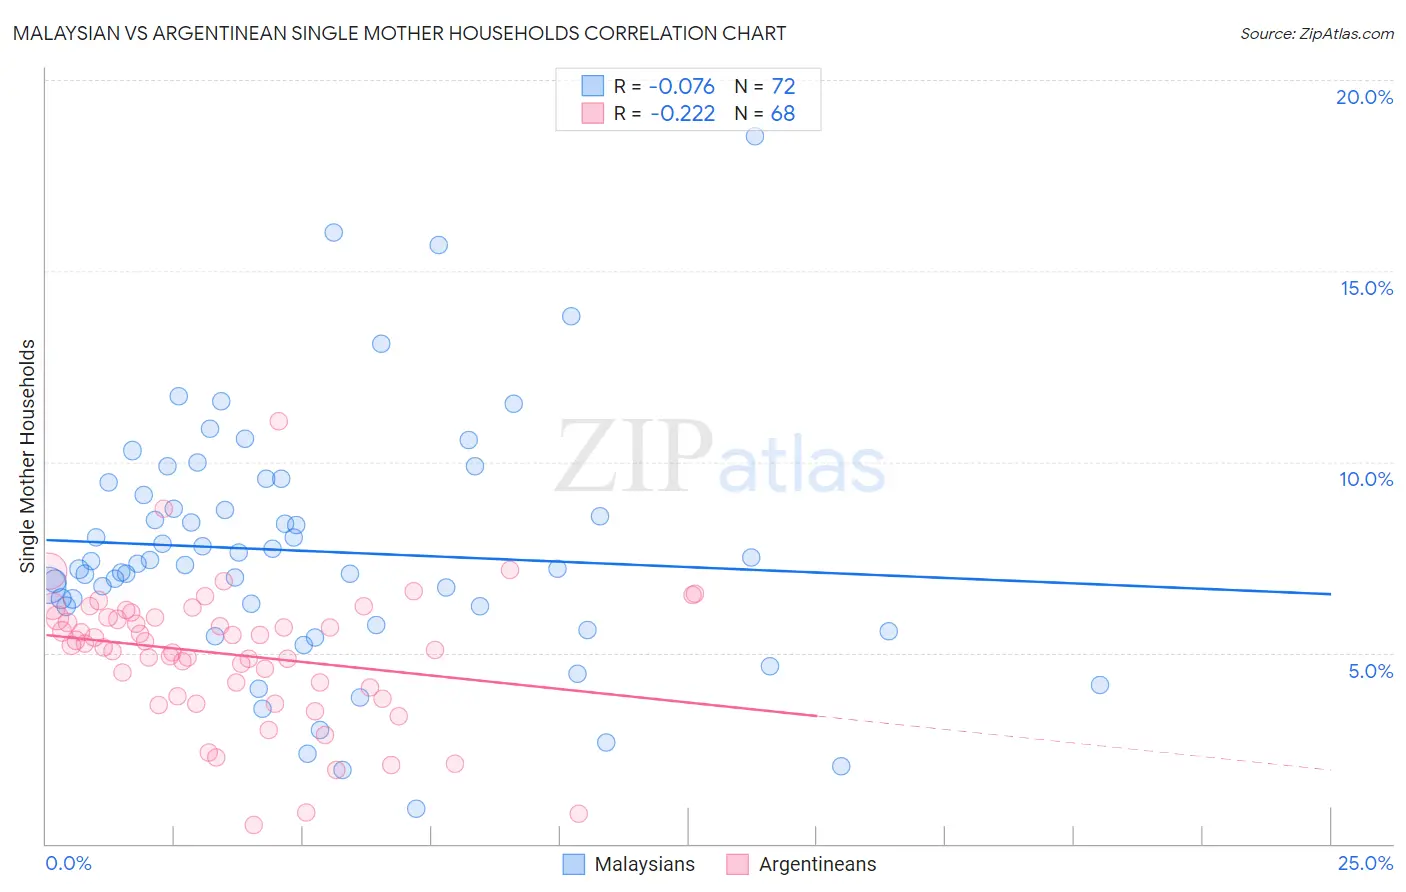
Malaysian vs Argentinean Single Mother Households Correlation Chart
The statistical analysis conducted on geographies consisting of 225,856,339 people shows a slight negative correlation between the proportion of Malaysians and percentage of single mother households in the United States with a correlation coefficient (R) of -0.076 and weighted average of 7.3%. Similarly, the statistical analysis conducted on geographies consisting of 296,614,684 people shows a weak negative correlation between the proportion of Argentineans and percentage of single mother households in the United States with a correlation coefficient (R) of -0.222 and weighted average of 5.8%, a difference of 25.0%.
Single Mother Households Correlation Summary
| Measurement | Malaysian | Argentinean |
| Minimum | 0.92% | 0.49% |
| Maximum | 18.5% | 11.1% |
| Range | 17.6% | 10.6% |
| Mean | 7.7% | 5.0% |
| Median | 7.3% | 5.2% |
| Interquartile 25% (IQ1) | 6.0% | 4.0% |
| Interquartile 75% (IQ3) | 9.3% | 5.9% |
| Interquartile Range (IQR) | 3.3% | 1.9% |
| Standard Deviation (Sample) | 3.2% | 1.8% |
| Standard Deviation (Population) | 3.2% | 1.8% |
Similar Demographics by Single Mother Households
Demographics Similar to Malaysians by Single Mother Households
In terms of single mother households, the demographic groups most similar to Malaysians are Alaskan Athabascan (7.3%, a difference of 0.020%), Immigrants from Africa (7.3%, a difference of 0.34%), Bermudan (7.3%, a difference of 0.36%), Cajun (7.3%, a difference of 0.41%), and Immigrants from Ecuador (7.3%, a difference of 0.46%).
| Demographics | Rating | Rank | Single Mother Households |
| Cubans | 0.6 /100 | #244 | Tragic 7.2% |
| Immigrants | Cambodia | 0.5 /100 | #245 | Tragic 7.2% |
| Nicaraguans | 0.5 /100 | #246 | Tragic 7.2% |
| Dutch West Indians | 0.4 /100 | #247 | Tragic 7.3% |
| Spanish American Indians | 0.4 /100 | #248 | Tragic 7.3% |
| Bermudans | 0.4 /100 | #249 | Tragic 7.3% |
| Immigrants | Africa | 0.4 /100 | #250 | Tragic 7.3% |
| Malaysians | 0.3 /100 | #251 | Tragic 7.3% |
| Alaskan Athabascans | 0.3 /100 | #252 | Tragic 7.3% |
| Cajuns | 0.3 /100 | #253 | Tragic 7.3% |
| Immigrants | Ecuador | 0.3 /100 | #254 | Tragic 7.3% |
| Mexican American Indians | 0.2 /100 | #255 | Tragic 7.4% |
| Seminole | 0.2 /100 | #256 | Tragic 7.4% |
| Alaska Natives | 0.2 /100 | #257 | Tragic 7.4% |
| Pueblo | 0.2 /100 | #258 | Tragic 7.4% |
Demographics Similar to Argentineans by Single Mother Households
In terms of single mother households, the demographic groups most similar to Argentineans are Tongan (5.8%, a difference of 0.020%), Belgian (5.8%, a difference of 0.080%), Immigrants from Uzbekistan (5.9%, a difference of 0.14%), Immigrants from Argentina (5.9%, a difference of 0.21%), and South African (5.8%, a difference of 0.22%).
| Demographics | Rating | Rank | Single Mother Households |
| Dutch | 95.1 /100 | #114 | Exceptional 5.8% |
| Irish | 94.8 /100 | #115 | Exceptional 5.8% |
| Pennsylvania Germans | 94.7 /100 | #116 | Exceptional 5.8% |
| Bolivians | 94.6 /100 | #117 | Exceptional 5.8% |
| Laotians | 94.3 /100 | #118 | Exceptional 5.8% |
| South Africans | 94.1 /100 | #119 | Exceptional 5.8% |
| Tongans | 93.7 /100 | #120 | Exceptional 5.8% |
| Argentineans | 93.7 /100 | #121 | Exceptional 5.8% |
| Belgians | 93.5 /100 | #122 | Exceptional 5.8% |
| Immigrants | Uzbekistan | 93.4 /100 | #123 | Exceptional 5.9% |
| Immigrants | Argentina | 93.2 /100 | #124 | Exceptional 5.9% |
| Slavs | 92.9 /100 | #125 | Exceptional 5.9% |
| Welsh | 92.8 /100 | #126 | Exceptional 5.9% |
| Lebanese | 92.4 /100 | #127 | Exceptional 5.9% |
| Czechoslovakians | 92.2 /100 | #128 | Exceptional 5.9% |