Malaysian vs Palestinian 8th Grade
COMPARE
Malaysian
Palestinian
8th Grade
8th Grade Comparison
Malaysians
Palestinians
94.5%
8TH GRADE
0.0/ 100
METRIC RATING
288th/ 347
METRIC RANK
96.2%
8TH GRADE
94.6/ 100
METRIC RATING
124th/ 347
METRIC RANK
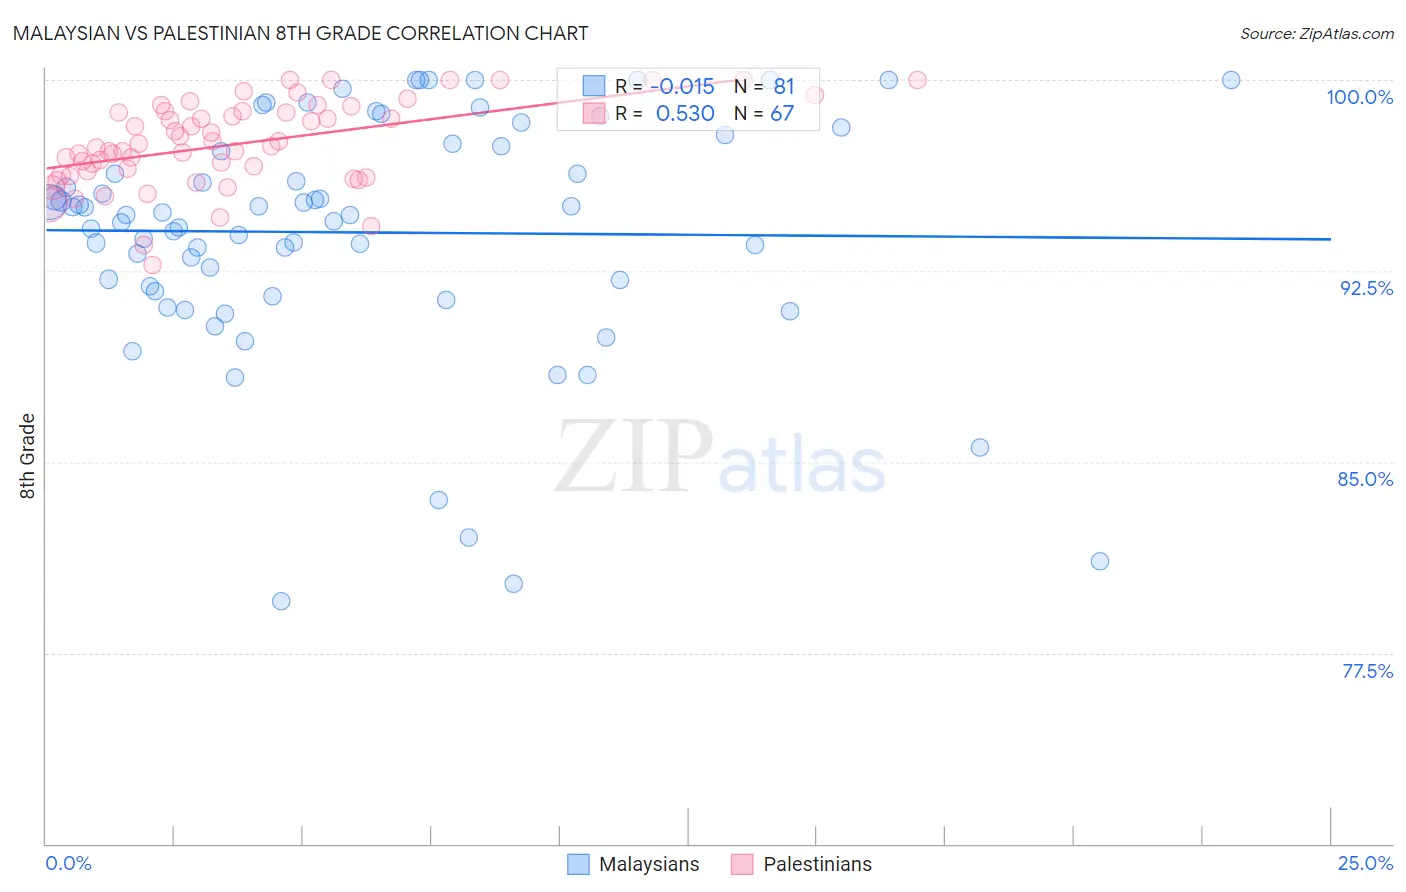
Malaysian vs Palestinian 8th Grade Correlation Chart
The statistical analysis conducted on geographies consisting of 226,107,000 people shows no correlation between the proportion of Malaysians and percentage of population with at least 8th grade education in the United States with a correlation coefficient (R) of -0.015 and weighted average of 94.5%. Similarly, the statistical analysis conducted on geographies consisting of 216,424,519 people shows a substantial positive correlation between the proportion of Palestinians and percentage of population with at least 8th grade education in the United States with a correlation coefficient (R) of 0.530 and weighted average of 96.2%, a difference of 1.8%.
8th Grade Correlation Summary
| Measurement | Malaysian | Palestinian |
| Minimum | 79.5% | 92.7% |
| Maximum | 100.0% | 100.0% |
| Range | 20.5% | 7.3% |
| Mean | 94.0% | 97.5% |
| Median | 94.7% | 97.4% |
| Interquartile 25% (IQ1) | 91.8% | 96.3% |
| Interquartile 75% (IQ3) | 97.4% | 98.8% |
| Interquartile Range (IQR) | 5.6% | 2.5% |
| Standard Deviation (Sample) | 4.7% | 1.7% |
| Standard Deviation (Population) | 4.6% | 1.7% |
Similar Demographics by 8th Grade
Demographics Similar to Malaysians by 8th Grade
In terms of 8th grade, the demographic groups most similar to Malaysians are Tohono O'odham (94.5%, a difference of 0.020%), Immigrants from Peru (94.5%, a difference of 0.030%), British West Indian (94.4%, a difference of 0.060%), Immigrants from Barbados (94.5%, a difference of 0.080%), and Immigrants from Philippines (94.6%, a difference of 0.11%).
| Demographics | Rating | Rank | 8th Grade |
| Immigrants | Bolivia | 0.1 /100 | #281 | Tragic 94.6% |
| Immigrants | Eritrea | 0.1 /100 | #282 | Tragic 94.6% |
| Immigrants | St. Vincent and the Grenadines | 0.1 /100 | #283 | Tragic 94.6% |
| Immigrants | Philippines | 0.1 /100 | #284 | Tragic 94.6% |
| Immigrants | Barbados | 0.0 /100 | #285 | Tragic 94.5% |
| Immigrants | Peru | 0.0 /100 | #286 | Tragic 94.5% |
| Tohono O'odham | 0.0 /100 | #287 | Tragic 94.5% |
| Malaysians | 0.0 /100 | #288 | Tragic 94.5% |
| British West Indians | 0.0 /100 | #289 | Tragic 94.4% |
| Immigrants | West Indies | 0.0 /100 | #290 | Tragic 94.3% |
| Immigrants | Grenada | 0.0 /100 | #291 | Tragic 94.3% |
| Bangladeshis | 0.0 /100 | #292 | Tragic 94.3% |
| Yaqui | 0.0 /100 | #293 | Tragic 94.2% |
| Houma | 0.0 /100 | #294 | Tragic 94.2% |
| Fijians | 0.0 /100 | #295 | Tragic 94.2% |
Demographics Similar to Palestinians by 8th Grade
In terms of 8th grade, the demographic groups most similar to Palestinians are Filipino (96.2%, a difference of 0.0%), Immigrants from Romania (96.2%, a difference of 0.010%), Immigrants from Switzerland (96.2%, a difference of 0.020%), Immigrants from France (96.2%, a difference of 0.020%), and Immigrants from Bulgaria (96.2%, a difference of 0.020%).
| Demographics | Rating | Rank | 8th Grade |
| Immigrants | Croatia | 96.0 /100 | #117 | Exceptional 96.2% |
| Immigrants | Norway | 95.7 /100 | #118 | Exceptional 96.2% |
| Immigrants | Switzerland | 95.3 /100 | #119 | Exceptional 96.2% |
| Immigrants | France | 95.3 /100 | #120 | Exceptional 96.2% |
| Immigrants | Bulgaria | 95.3 /100 | #121 | Exceptional 96.2% |
| Immigrants | Europe | 95.3 /100 | #122 | Exceptional 96.2% |
| Filipinos | 94.6 /100 | #123 | Exceptional 96.2% |
| Palestinians | 94.6 /100 | #124 | Exceptional 96.2% |
| Immigrants | Romania | 94.1 /100 | #125 | Exceptional 96.2% |
| Choctaw | 94.0 /100 | #126 | Exceptional 96.2% |
| Immigrants | Serbia | 94.0 /100 | #127 | Exceptional 96.2% |
| Immigrants | Bosnia and Herzegovina | 93.9 /100 | #128 | Exceptional 96.2% |
| Cheyenne | 93.3 /100 | #129 | Exceptional 96.1% |
| Soviet Union | 92.6 /100 | #130 | Exceptional 96.1% |
| Pueblo | 92.3 /100 | #131 | Exceptional 96.1% |