Luxembourger vs Bermudan 9th Grade
COMPARE
Luxembourger
Bermudan
9th Grade
9th Grade Comparison
Luxembourgers
Bermudans
96.3%
9TH GRADE
100.0/ 100
METRIC RATING
33rd/ 347
METRIC RANK
95.0%
9TH GRADE
65.8/ 100
METRIC RATING
162nd/ 347
METRIC RANK
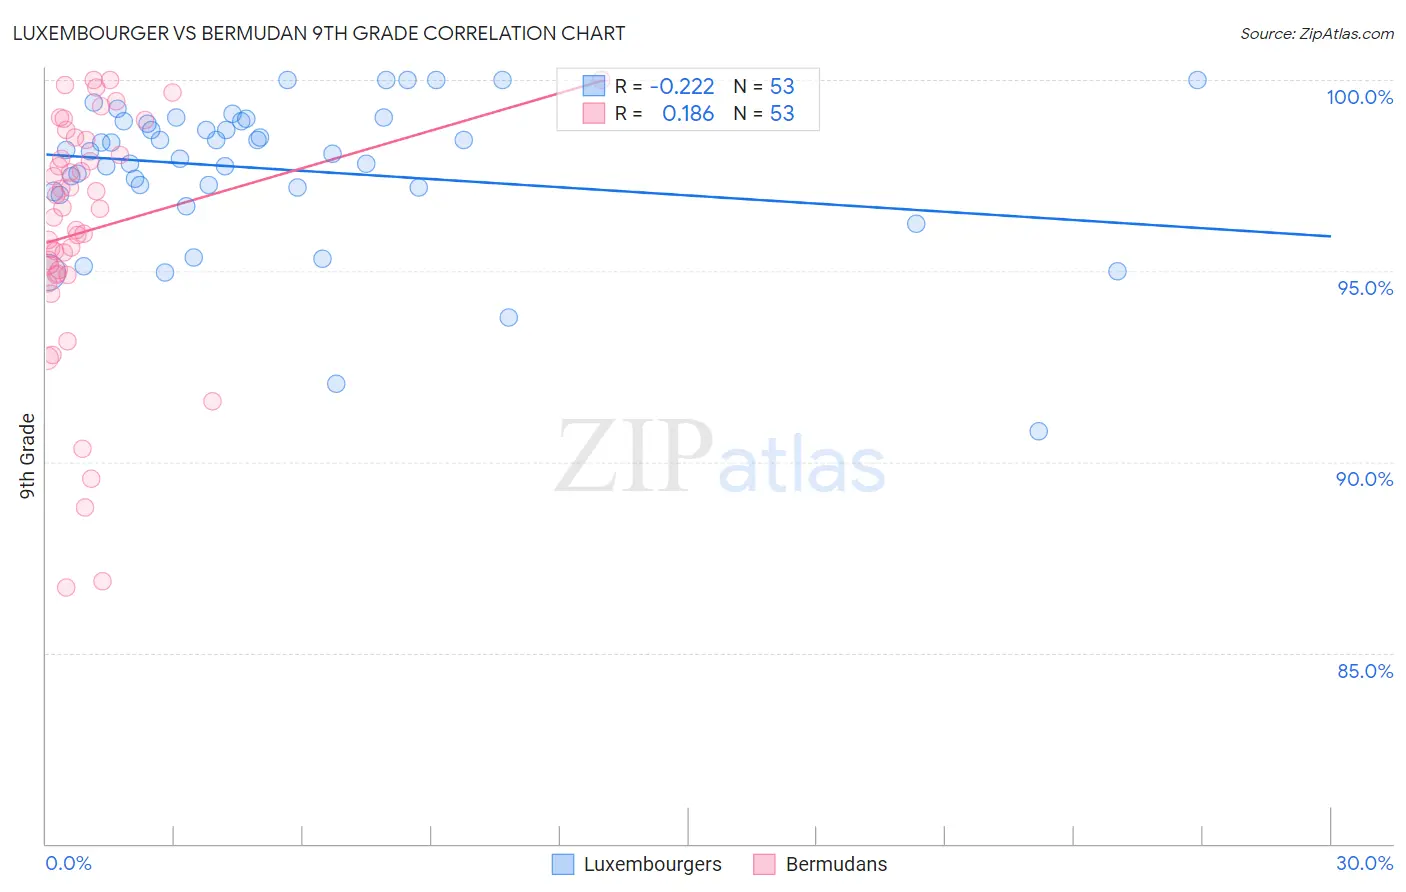
Luxembourger vs Bermudan 9th Grade Correlation Chart
The statistical analysis conducted on geographies consisting of 144,676,190 people shows a weak negative correlation between the proportion of Luxembourgers and percentage of population with at least 9th grade education in the United States with a correlation coefficient (R) of -0.222 and weighted average of 96.3%. Similarly, the statistical analysis conducted on geographies consisting of 55,732,793 people shows a poor positive correlation between the proportion of Bermudans and percentage of population with at least 9th grade education in the United States with a correlation coefficient (R) of 0.186 and weighted average of 95.0%, a difference of 1.3%.
9th Grade Correlation Summary
| Measurement | Luxembourger | Bermudan |
| Minimum | 90.8% | 86.7% |
| Maximum | 100.0% | 100.0% |
| Range | 9.2% | 13.3% |
| Mean | 97.7% | 96.1% |
| Median | 98.1% | 96.6% |
| Interquartile 25% (IQ1) | 97.1% | 94.9% |
| Interquartile 75% (IQ3) | 98.9% | 98.5% |
| Interquartile Range (IQR) | 1.8% | 3.6% |
| Standard Deviation (Sample) | 1.9% | 3.2% |
| Standard Deviation (Population) | 1.9% | 3.2% |
Similar Demographics by 9th Grade
Demographics Similar to Luxembourgers by 9th Grade
In terms of 9th grade, the demographic groups most similar to Luxembourgers are British (96.3%, a difference of 0.010%), Belgian (96.3%, a difference of 0.010%), Maltese (96.3%, a difference of 0.020%), Hungarian (96.2%, a difference of 0.030%), and Chinese (96.3%, a difference of 0.040%).
| Demographics | Rating | Rank | 9th Grade |
| French Canadians | 100.0 /100 | #26 | Exceptional 96.3% |
| Scotch-Irish | 100.0 /100 | #27 | Exceptional 96.3% |
| Eastern Europeans | 100.0 /100 | #28 | Exceptional 96.3% |
| Chinese | 100.0 /100 | #29 | Exceptional 96.3% |
| Maltese | 100.0 /100 | #30 | Exceptional 96.3% |
| British | 100.0 /100 | #31 | Exceptional 96.3% |
| Belgians | 100.0 /100 | #32 | Exceptional 96.3% |
| Luxembourgers | 100.0 /100 | #33 | Exceptional 96.3% |
| Hungarians | 100.0 /100 | #34 | Exceptional 96.2% |
| Bulgarians | 99.9 /100 | #35 | Exceptional 96.2% |
| Northern Europeans | 99.9 /100 | #36 | Exceptional 96.2% |
| Estonians | 99.9 /100 | #37 | Exceptional 96.1% |
| Immigrants | Scotland | 99.9 /100 | #38 | Exceptional 96.1% |
| Ottawa | 99.9 /100 | #39 | Exceptional 96.1% |
| Slavs | 99.9 /100 | #40 | Exceptional 96.1% |
Demographics Similar to Bermudans by 9th Grade
In terms of 9th grade, the demographic groups most similar to Bermudans are Immigrants from Ukraine (95.0%, a difference of 0.010%), Immigrants from Italy (95.0%, a difference of 0.010%), French American Indian (95.0%, a difference of 0.010%), Pakistani (95.0%, a difference of 0.010%), and Venezuelan (95.0%, a difference of 0.020%).
| Demographics | Rating | Rank | 9th Grade |
| Immigrants | Kazakhstan | 74.7 /100 | #155 | Good 95.1% |
| Immigrants | Kenya | 73.1 /100 | #156 | Good 95.0% |
| Mongolians | 73.0 /100 | #157 | Good 95.0% |
| Egyptians | 70.1 /100 | #158 | Good 95.0% |
| Immigrants | Ukraine | 67.4 /100 | #159 | Good 95.0% |
| Immigrants | Italy | 66.6 /100 | #160 | Good 95.0% |
| French American Indians | 66.5 /100 | #161 | Good 95.0% |
| Bermudans | 65.8 /100 | #162 | Good 95.0% |
| Pakistanis | 64.1 /100 | #163 | Good 95.0% |
| Venezuelans | 63.6 /100 | #164 | Good 95.0% |
| Blackfeet | 62.6 /100 | #165 | Good 95.0% |
| Ute | 62.6 /100 | #166 | Good 95.0% |
| Immigrants | Brazil | 61.1 /100 | #167 | Good 95.0% |
| Chileans | 60.7 /100 | #168 | Good 95.0% |
| Spaniards | 59.6 /100 | #169 | Average 94.9% |