Yuman vs Marshallese Single Father Households
COMPARE
Yuman
Marshallese
Single Father Households
Single Father Households Comparison
Yuman
Marshallese
3.3%
SINGLE FATHER HOUSEHOLDS
0.0/ 100
METRIC RATING
334th/ 347
METRIC RANK
2.4%
SINGLE FATHER HOUSEHOLDS
9.7/ 100
METRIC RATING
225th/ 347
METRIC RANK
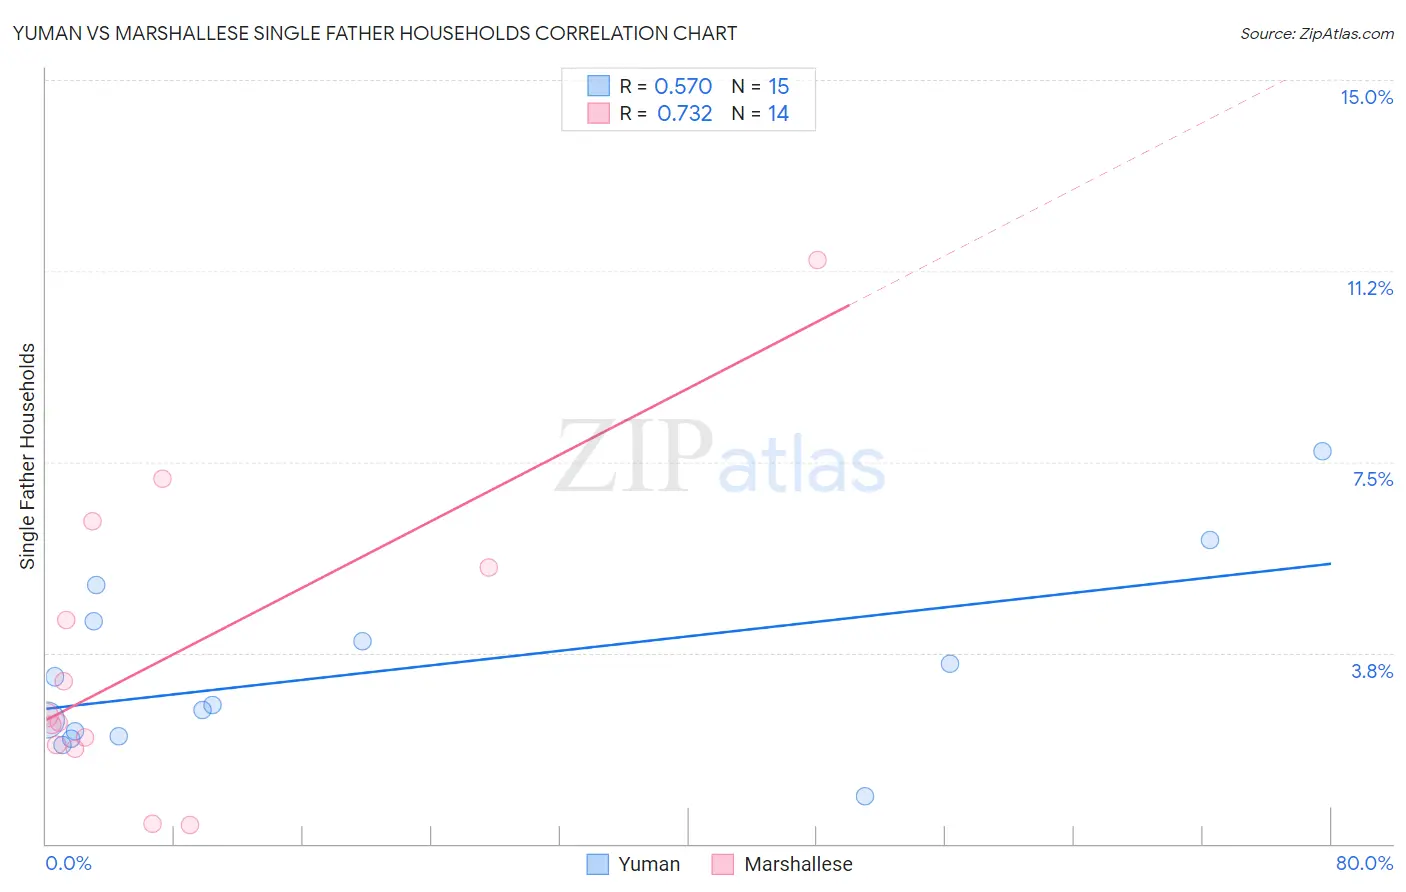
Yuman vs Marshallese Single Father Households Correlation Chart
The statistical analysis conducted on geographies consisting of 40,610,556 people shows a substantial positive correlation between the proportion of Yuman and percentage of single father households in the United States with a correlation coefficient (R) of 0.570 and weighted average of 3.3%. Similarly, the statistical analysis conducted on geographies consisting of 14,759,622 people shows a strong positive correlation between the proportion of Marshallese and percentage of single father households in the United States with a correlation coefficient (R) of 0.732 and weighted average of 2.4%, a difference of 35.4%.
Single Father Households Correlation Summary
| Measurement | Yuman | Marshallese |
| Minimum | 0.94% | 0.37% |
| Maximum | 7.7% | 11.5% |
| Range | 6.8% | 11.1% |
| Mean | 3.4% | 3.7% |
| Median | 2.7% | 2.5% |
| Interquartile 25% (IQ1) | 2.1% | 1.9% |
| Interquartile 75% (IQ3) | 4.4% | 5.4% |
| Interquartile Range (IQR) | 2.3% | 3.5% |
| Standard Deviation (Sample) | 1.8% | 3.0% |
| Standard Deviation (Population) | 1.7% | 2.9% |
Similar Demographics by Single Father Households
Demographics Similar to Yuman by Single Father Households
In terms of single father households, the demographic groups most similar to Yuman are Colville (3.3%, a difference of 0.020%), Paiute (3.3%, a difference of 0.050%), Pueblo (3.3%, a difference of 0.30%), Sioux (3.3%, a difference of 0.98%), and Alaskan Athabascan (3.4%, a difference of 2.5%).
| Demographics | Rating | Rank | Single Father Households |
| Bangladeshis | 0.0 /100 | #327 | Tragic 3.1% |
| Immigrants | Cabo Verde | 0.0 /100 | #328 | Tragic 3.1% |
| Chippewa | 0.0 /100 | #329 | Tragic 3.1% |
| Nepalese | 0.0 /100 | #330 | Tragic 3.1% |
| Navajo | 0.0 /100 | #331 | Tragic 3.2% |
| Yaqui | 0.0 /100 | #332 | Tragic 3.2% |
| Natives/Alaskans | 0.0 /100 | #333 | Tragic 3.2% |
| Yuman | 0.0 /100 | #334 | Tragic 3.3% |
| Colville | 0.0 /100 | #335 | Tragic 3.3% |
| Paiute | 0.0 /100 | #336 | Tragic 3.3% |
| Pueblo | 0.0 /100 | #337 | Tragic 3.3% |
| Sioux | 0.0 /100 | #338 | Tragic 3.3% |
| Alaskan Athabascans | 0.0 /100 | #339 | Tragic 3.4% |
| Alaska Natives | 0.0 /100 | #340 | Tragic 3.5% |
| Crow | 0.0 /100 | #341 | Tragic 3.5% |
Demographics Similar to Marshallese by Single Father Households
In terms of single father households, the demographic groups most similar to Marshallese are Black/African American (2.4%, a difference of 0.010%), American (2.4%, a difference of 0.080%), Immigrants from Ghana (2.4%, a difference of 0.12%), Immigrants from Bahamas (2.4%, a difference of 0.17%), and Immigrants from Zaire (2.4%, a difference of 0.23%).
| Demographics | Rating | Rank | Single Father Households |
| Immigrants | Ethiopia | 13.4 /100 | #218 | Poor 2.4% |
| Sudanese | 13.0 /100 | #219 | Poor 2.4% |
| Ghanaians | 12.9 /100 | #220 | Poor 2.4% |
| Immigrants | Burma/Myanmar | 12.1 /100 | #221 | Poor 2.4% |
| Immigrants | Eastern Africa | 11.9 /100 | #222 | Poor 2.4% |
| Immigrants | Uruguay | 11.0 /100 | #223 | Poor 2.4% |
| Immigrants | Bahamas | 10.6 /100 | #224 | Poor 2.4% |
| Marshallese | 9.7 /100 | #225 | Tragic 2.4% |
| Blacks/African Americans | 9.7 /100 | #226 | Tragic 2.4% |
| Americans | 9.3 /100 | #227 | Tragic 2.4% |
| Immigrants | Ghana | 9.1 /100 | #228 | Tragic 2.4% |
| Immigrants | Zaire | 8.6 /100 | #229 | Tragic 2.4% |
| Sub-Saharan Africans | 8.3 /100 | #230 | Tragic 2.4% |
| Immigrants | Nonimmigrants | 7.6 /100 | #231 | Tragic 2.4% |
| Pennsylvania Germans | 7.3 /100 | #232 | Tragic 2.4% |