German Russian vs Immigrants from Moldova Average Family Size
COMPARE
German Russian
Immigrants from Moldova
Average Family Size
Average Family Size Comparison
German Russians
Immigrants from Moldova
3.15
AVERAGE FAMILY SIZE
0.4/ 100
METRIC RATING
283rd/ 347
METRIC RANK
3.18
AVERAGE FAMILY SIZE
2.9/ 100
METRIC RATING
243rd/ 347
METRIC RANK
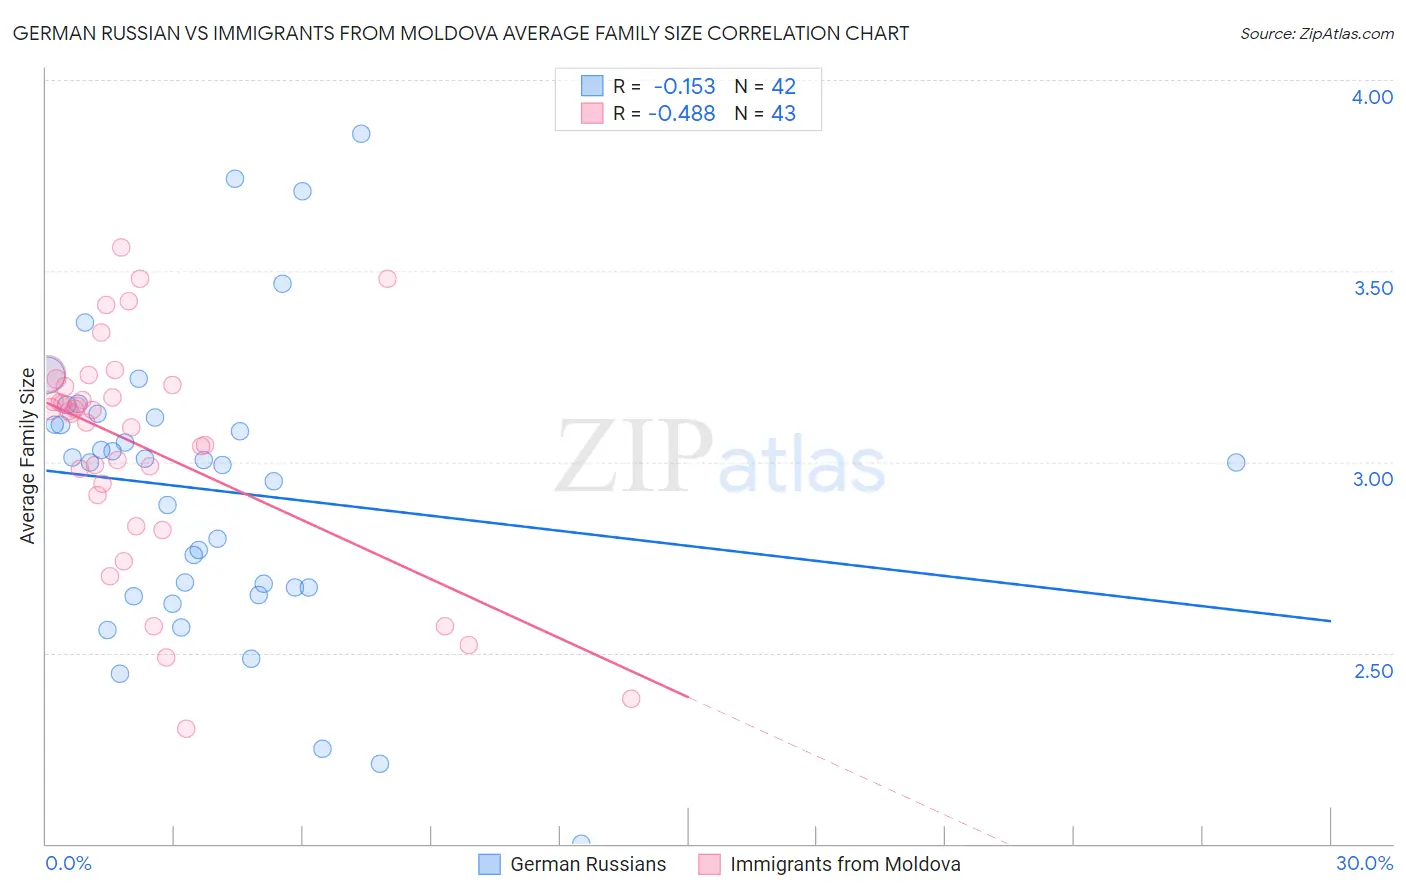
German Russian vs Immigrants from Moldova Average Family Size Correlation Chart
The statistical analysis conducted on geographies consisting of 96,451,127 people shows a poor negative correlation between the proportion of German Russians and average family size in the United States with a correlation coefficient (R) of -0.153 and weighted average of 3.15. Similarly, the statistical analysis conducted on geographies consisting of 124,363,893 people shows a moderate negative correlation between the proportion of Immigrants from Moldova and average family size in the United States with a correlation coefficient (R) of -0.488 and weighted average of 3.18, a difference of 0.97%.
Average Family Size Correlation Summary
| Measurement | German Russian | Immigrants from Moldova |
| Minimum | 2.00 | 2.30 |
| Maximum | 3.86 | 3.56 |
| Range | 1.86 | 1.26 |
| Mean | 2.92 | 3.04 |
| Median | 3.00 | 3.13 |
| Interquartile 25% (IQ1) | 2.67 | 2.91 |
| Interquartile 75% (IQ3) | 3.11 | 3.20 |
| Interquartile Range (IQR) | 0.44 | 0.29 |
| Standard Deviation (Sample) | 0.39 | 0.30 |
| Standard Deviation (Population) | 0.38 | 0.29 |
Similar Demographics by Average Family Size
Demographics Similar to German Russians by Average Family Size
In terms of average family size, the demographic groups most similar to German Russians are Yugoslavian (3.15, a difference of 0.010%), Immigrants from Denmark (3.15, a difference of 0.020%), Immigrants from France (3.15, a difference of 0.020%), Immigrants from England (3.15, a difference of 0.060%), and White/Caucasian (3.14, a difference of 0.070%).
| Demographics | Rating | Rank | Average Family Size |
| Immigrants | Bosnia and Herzegovina | 0.5 /100 | #276 | Tragic 3.15 |
| Swiss | 0.5 /100 | #277 | Tragic 3.15 |
| Okinawans | 0.5 /100 | #278 | Tragic 3.15 |
| Immigrants | Europe | 0.5 /100 | #279 | Tragic 3.15 |
| Immigrants | England | 0.4 /100 | #280 | Tragic 3.15 |
| Immigrants | Denmark | 0.4 /100 | #281 | Tragic 3.15 |
| Yugoslavians | 0.4 /100 | #282 | Tragic 3.15 |
| German Russians | 0.4 /100 | #283 | Tragic 3.15 |
| Immigrants | France | 0.4 /100 | #284 | Tragic 3.15 |
| Whites/Caucasians | 0.3 /100 | #285 | Tragic 3.14 |
| Immigrants | Netherlands | 0.3 /100 | #286 | Tragic 3.14 |
| Greeks | 0.3 /100 | #287 | Tragic 3.14 |
| Immigrants | Czechoslovakia | 0.3 /100 | #288 | Tragic 3.14 |
| Immigrants | Norway | 0.3 /100 | #289 | Tragic 3.14 |
| Cypriots | 0.3 /100 | #290 | Tragic 3.14 |
Demographics Similar to Immigrants from Moldova by Average Family Size
In terms of average family size, the demographic groups most similar to Immigrants from Moldova are Hungarian (3.18, a difference of 0.0%), Immigrants from Southern Europe (3.18, a difference of 0.010%), Immigrants from Japan (3.18, a difference of 0.020%), Osage (3.18, a difference of 0.040%), and Immigrants from Brazil (3.18, a difference of 0.040%).
| Demographics | Rating | Rank | Average Family Size |
| Immigrants | Portugal | 4.2 /100 | #236 | Tragic 3.18 |
| Immigrants | Romania | 3.7 /100 | #237 | Tragic 3.18 |
| Romanians | 3.7 /100 | #238 | Tragic 3.18 |
| Houma | 3.4 /100 | #239 | Tragic 3.18 |
| Osage | 3.2 /100 | #240 | Tragic 3.18 |
| Immigrants | Japan | 3.0 /100 | #241 | Tragic 3.18 |
| Hungarians | 3.0 /100 | #242 | Tragic 3.18 |
| Immigrants | Moldova | 2.9 /100 | #243 | Tragic 3.18 |
| Immigrants | Southern Europe | 2.9 /100 | #244 | Tragic 3.18 |
| Immigrants | Brazil | 2.7 /100 | #245 | Tragic 3.18 |
| Danes | 2.5 /100 | #246 | Tragic 3.17 |
| Cajuns | 2.4 /100 | #247 | Tragic 3.17 |
| Immigrants | Belarus | 2.3 /100 | #248 | Tragic 3.17 |
| Immigrants | Eastern Europe | 2.1 /100 | #249 | Tragic 3.17 |
| Puget Sound Salish | 1.9 /100 | #250 | Tragic 3.17 |