Lithuanian vs Immigrants from Moldova Female Poverty Among 18-24 Year Olds
COMPARE
Lithuanian
Immigrants from Moldova
Female Poverty Among 18-24 Year Olds
Female Poverty Among 18-24 Year Olds Comparison
Lithuanians
Immigrants from Moldova
18.7%
FEMALE POVERTY AMONG 18-24 YEAR OLDS
99.7/ 100
METRIC RATING
73rd/ 347
METRIC RANK
17.9%
FEMALE POVERTY AMONG 18-24 YEAR OLDS
100.0/ 100
METRIC RATING
32nd/ 347
METRIC RANK
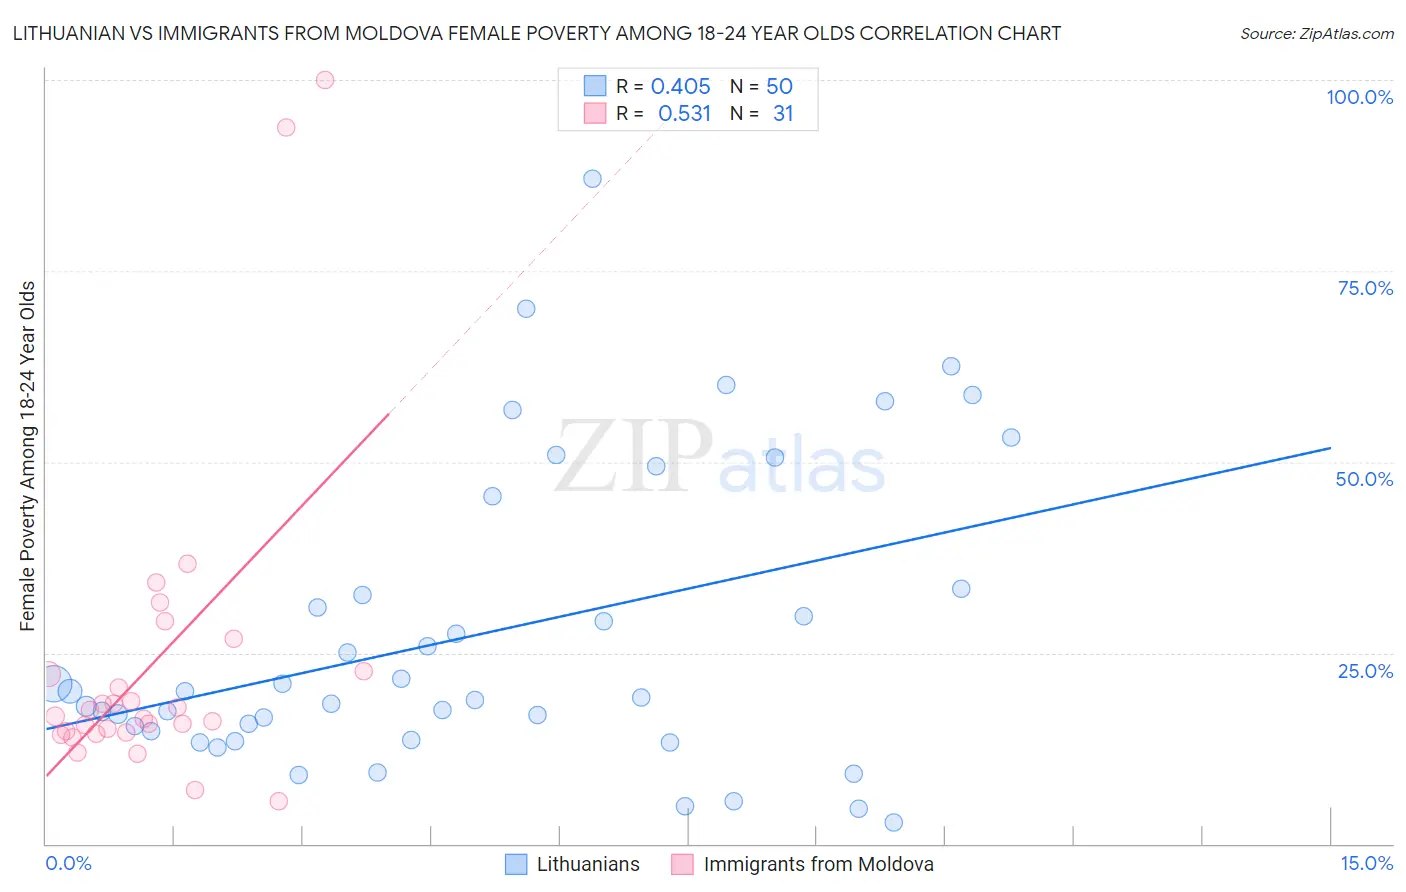
Lithuanian vs Immigrants from Moldova Female Poverty Among 18-24 Year Olds Correlation Chart
The statistical analysis conducted on geographies consisting of 405,735,156 people shows a moderate positive correlation between the proportion of Lithuanians and poverty level among females between the ages 18 and 24 in the United States with a correlation coefficient (R) of 0.405 and weighted average of 18.7%. Similarly, the statistical analysis conducted on geographies consisting of 123,051,261 people shows a substantial positive correlation between the proportion of Immigrants from Moldova and poverty level among females between the ages 18 and 24 in the United States with a correlation coefficient (R) of 0.531 and weighted average of 17.9%, a difference of 4.6%.
Female Poverty Among 18-24 Year Olds Correlation Summary
| Measurement | Lithuanian | Immigrants from Moldova |
| Minimum | 2.8% | 5.6% |
| Maximum | 87.0% | 100.0% |
| Range | 84.2% | 94.4% |
| Mean | 27.5% | 23.5% |
| Median | 19.6% | 16.7% |
| Interquartile 25% (IQ1) | 14.8% | 14.5% |
| Interquartile 75% (IQ3) | 33.3% | 22.6% |
| Interquartile Range (IQR) | 18.6% | 8.1% |
| Standard Deviation (Sample) | 19.6% | 20.8% |
| Standard Deviation (Population) | 19.4% | 20.5% |
Similar Demographics by Female Poverty Among 18-24 Year Olds
Demographics Similar to Lithuanians by Female Poverty Among 18-24 Year Olds
In terms of female poverty among 18-24 year olds, the demographic groups most similar to Lithuanians are Armenian (18.7%, a difference of 0.040%), Immigrants from Haiti (18.7%, a difference of 0.060%), Immigrants from Costa Rica (18.7%, a difference of 0.12%), Hawaiian (18.7%, a difference of 0.19%), and Immigrants from Bulgaria (18.6%, a difference of 0.23%).
| Demographics | Rating | Rank | Female Poverty Among 18-24 Year Olds |
| Jordanians | 99.8 /100 | #66 | Exceptional 18.6% |
| Immigrants | Korea | 99.8 /100 | #67 | Exceptional 18.6% |
| Brazilians | 99.8 /100 | #68 | Exceptional 18.6% |
| Immigrants | Bulgaria | 99.7 /100 | #69 | Exceptional 18.6% |
| Immigrants | Costa Rica | 99.7 /100 | #70 | Exceptional 18.7% |
| Immigrants | Haiti | 99.7 /100 | #71 | Exceptional 18.7% |
| Armenians | 99.7 /100 | #72 | Exceptional 18.7% |
| Lithuanians | 99.7 /100 | #73 | Exceptional 18.7% |
| Hawaiians | 99.6 /100 | #74 | Exceptional 18.7% |
| Poles | 99.6 /100 | #75 | Exceptional 18.8% |
| Immigrants | Cambodia | 99.5 /100 | #76 | Exceptional 18.8% |
| Costa Ricans | 99.5 /100 | #77 | Exceptional 18.8% |
| Immigrants | Europe | 99.5 /100 | #78 | Exceptional 18.8% |
| Uruguayans | 99.5 /100 | #79 | Exceptional 18.8% |
| Palestinians | 99.5 /100 | #80 | Exceptional 18.8% |
Demographics Similar to Immigrants from Moldova by Female Poverty Among 18-24 Year Olds
In terms of female poverty among 18-24 year olds, the demographic groups most similar to Immigrants from Moldova are Native Hawaiian (17.9%, a difference of 0.030%), Immigrants from Nicaragua (17.9%, a difference of 0.14%), Immigrants from Greece (17.9%, a difference of 0.18%), Immigrants from South America (17.9%, a difference of 0.23%), and Immigrants from Vietnam (17.8%, a difference of 0.25%).
| Demographics | Rating | Rank | Female Poverty Among 18-24 Year Olds |
| Immigrants | South Central Asia | 100.0 /100 | #25 | Exceptional 17.6% |
| Immigrants | Fiji | 100.0 /100 | #26 | Exceptional 17.7% |
| Colombians | 100.0 /100 | #27 | Exceptional 17.7% |
| Venezuelans | 100.0 /100 | #28 | Exceptional 17.7% |
| Portuguese | 100.0 /100 | #29 | Exceptional 17.8% |
| Immigrants | South Eastern Asia | 100.0 /100 | #30 | Exceptional 17.8% |
| Immigrants | Vietnam | 100.0 /100 | #31 | Exceptional 17.8% |
| Immigrants | Moldova | 100.0 /100 | #32 | Exceptional 17.9% |
| Native Hawaiians | 100.0 /100 | #33 | Exceptional 17.9% |
| Immigrants | Nicaragua | 100.0 /100 | #34 | Exceptional 17.9% |
| Immigrants | Greece | 100.0 /100 | #35 | Exceptional 17.9% |
| Immigrants | South America | 100.0 /100 | #36 | Exceptional 17.9% |
| Immigrants | Croatia | 100.0 /100 | #37 | Exceptional 17.9% |
| South Americans | 100.0 /100 | #38 | Exceptional 18.0% |
| Puget Sound Salish | 100.0 /100 | #39 | Exceptional 18.0% |