Lithuanian vs French Canadian In Labor Force | Age 35-44
COMPARE
Lithuanian
French Canadian
In Labor Force | Age 35-44
In Labor Force | Age 35-44 Comparison
Lithuanians
French Canadians
85.2%
IN LABOR FORCE | AGE 35-44
99.8/ 100
METRIC RATING
44th/ 347
METRIC RANK
84.3%
IN LABOR FORCE | AGE 35-44
44.3/ 100
METRIC RATING
177th/ 347
METRIC RANK
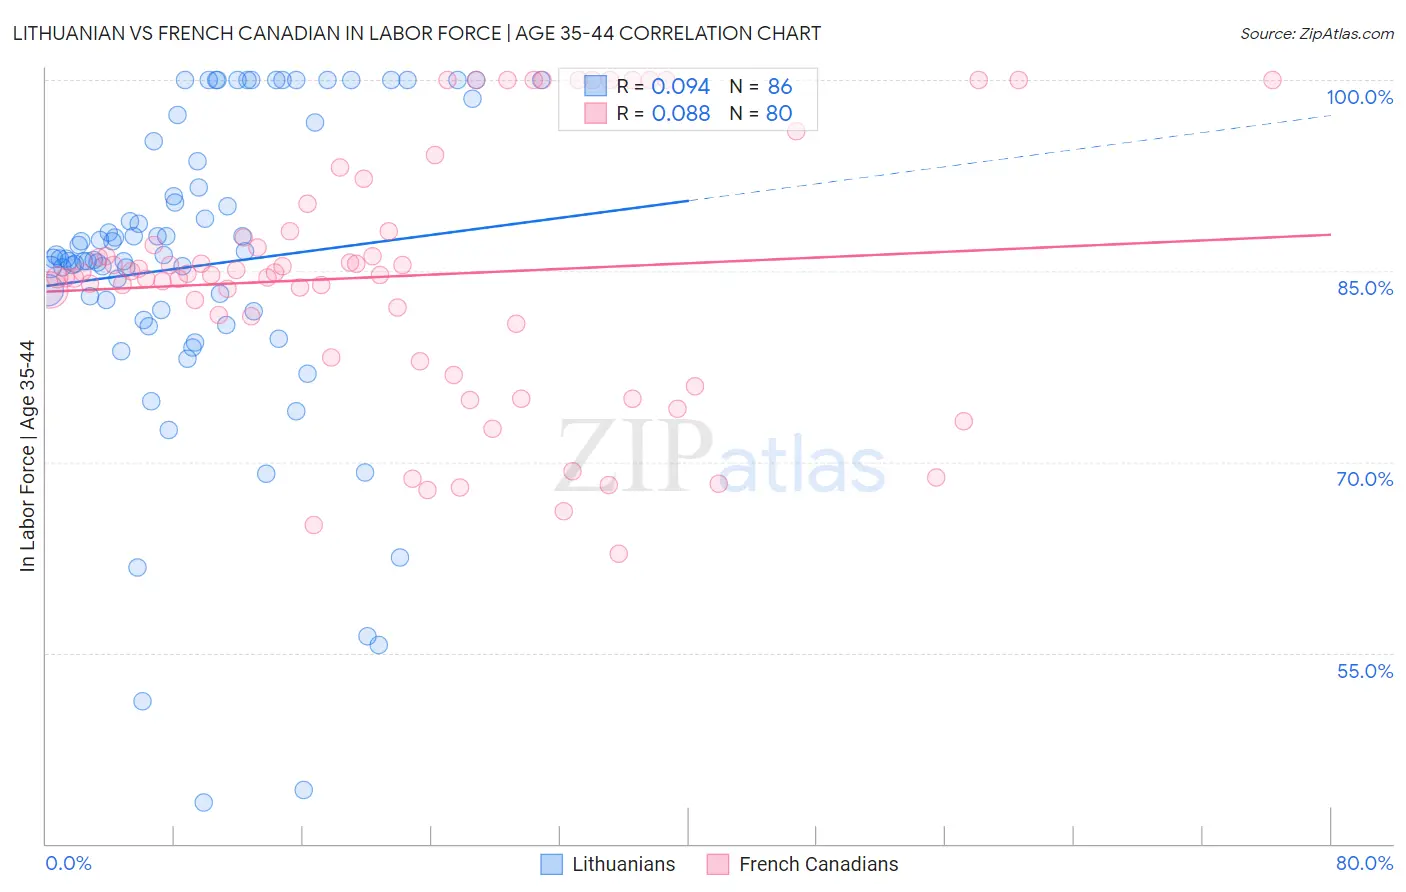
Lithuanian vs French Canadian In Labor Force | Age 35-44 Correlation Chart
The statistical analysis conducted on geographies consisting of 421,725,431 people shows a slight positive correlation between the proportion of Lithuanians and labor force participation rate among population between the ages 35 and 44 in the United States with a correlation coefficient (R) of 0.094 and weighted average of 85.2%. Similarly, the statistical analysis conducted on geographies consisting of 502,298,935 people shows a slight positive correlation between the proportion of French Canadians and labor force participation rate among population between the ages 35 and 44 in the United States with a correlation coefficient (R) of 0.088 and weighted average of 84.3%, a difference of 1.0%.
In Labor Force | Age 35-44 Correlation Summary
| Measurement | Lithuanian | French Canadian |
| Minimum | 43.2% | 62.7% |
| Maximum | 100.0% | 100.0% |
| Range | 56.8% | 37.3% |
| Mean | 85.4% | 84.6% |
| Median | 86.0% | 84.7% |
| Interquartile 25% (IQ1) | 81.8% | 79.5% |
| Interquartile 75% (IQ3) | 93.7% | 88.1% |
| Interquartile Range (IQR) | 11.9% | 8.6% |
| Standard Deviation (Sample) | 12.5% | 9.9% |
| Standard Deviation (Population) | 12.4% | 9.8% |
Similar Demographics by In Labor Force | Age 35-44
Demographics Similar to Lithuanians by In Labor Force | Age 35-44
In terms of in labor force | age 35-44, the demographic groups most similar to Lithuanians are Polish (85.2%, a difference of 0.0%), Immigrants from Bulgaria (85.2%, a difference of 0.010%), Immigrants from Zimbabwe (85.2%, a difference of 0.010%), Macedonian (85.2%, a difference of 0.010%), and Cypriot (85.2%, a difference of 0.010%).
| Demographics | Rating | Rank | In Labor Force | Age 35-44 |
| Kenyans | 99.8 /100 | #37 | Exceptional 85.2% |
| Immigrants | Poland | 99.8 /100 | #38 | Exceptional 85.2% |
| Eastern Europeans | 99.8 /100 | #39 | Exceptional 85.2% |
| Immigrants | Bulgaria | 99.8 /100 | #40 | Exceptional 85.2% |
| Immigrants | Zimbabwe | 99.8 /100 | #41 | Exceptional 85.2% |
| Macedonians | 99.8 /100 | #42 | Exceptional 85.2% |
| Poles | 99.8 /100 | #43 | Exceptional 85.2% |
| Lithuanians | 99.8 /100 | #44 | Exceptional 85.2% |
| Cypriots | 99.8 /100 | #45 | Exceptional 85.2% |
| Immigrants | Hong Kong | 99.8 /100 | #46 | Exceptional 85.2% |
| German Russians | 99.8 /100 | #47 | Exceptional 85.2% |
| Immigrants | Eritrea | 99.7 /100 | #48 | Exceptional 85.2% |
| Croatians | 99.7 /100 | #49 | Exceptional 85.2% |
| Thais | 99.7 /100 | #50 | Exceptional 85.2% |
| Immigrants | Albania | 99.7 /100 | #51 | Exceptional 85.1% |
Demographics Similar to French Canadians by In Labor Force | Age 35-44
In terms of in labor force | age 35-44, the demographic groups most similar to French Canadians are Northern European (84.3%, a difference of 0.0%), Immigrants from South Africa (84.3%, a difference of 0.010%), Sri Lankan (84.4%, a difference of 0.020%), Pakistani (84.4%, a difference of 0.030%), and Scandinavian (84.4%, a difference of 0.040%).
| Demographics | Rating | Rank | In Labor Force | Age 35-44 |
| Immigrants | Jordan | 52.5 /100 | #170 | Average 84.4% |
| Jordanians | 51.7 /100 | #171 | Average 84.4% |
| Scandinavians | 51.2 /100 | #172 | Average 84.4% |
| Immigrants | Trinidad and Tobago | 50.7 /100 | #173 | Average 84.4% |
| Immigrants | Iran | 50.0 /100 | #174 | Average 84.4% |
| Pakistanis | 48.2 /100 | #175 | Average 84.4% |
| Sri Lankans | 47.3 /100 | #176 | Average 84.4% |
| French Canadians | 44.3 /100 | #177 | Average 84.3% |
| Northern Europeans | 44.1 /100 | #178 | Average 84.3% |
| Immigrants | South Africa | 42.8 /100 | #179 | Average 84.3% |
| Danes | 38.8 /100 | #180 | Fair 84.3% |
| Immigrants | West Indies | 36.4 /100 | #181 | Fair 84.3% |
| Koreans | 36.3 /100 | #182 | Fair 84.3% |
| Barbadians | 36.2 /100 | #183 | Fair 84.3% |
| Armenians | 35.6 /100 | #184 | Fair 84.3% |