Liberian vs Laotian 11th Grade
COMPARE
Liberian
Laotian
11th Grade
11th Grade Comparison
Liberians
Laotians
92.3%
11TH GRADE
26.8/ 100
METRIC RATING
195th/ 347
METRIC RANK
92.6%
11TH GRADE
54.4/ 100
METRIC RATING
171st/ 347
METRIC RANK
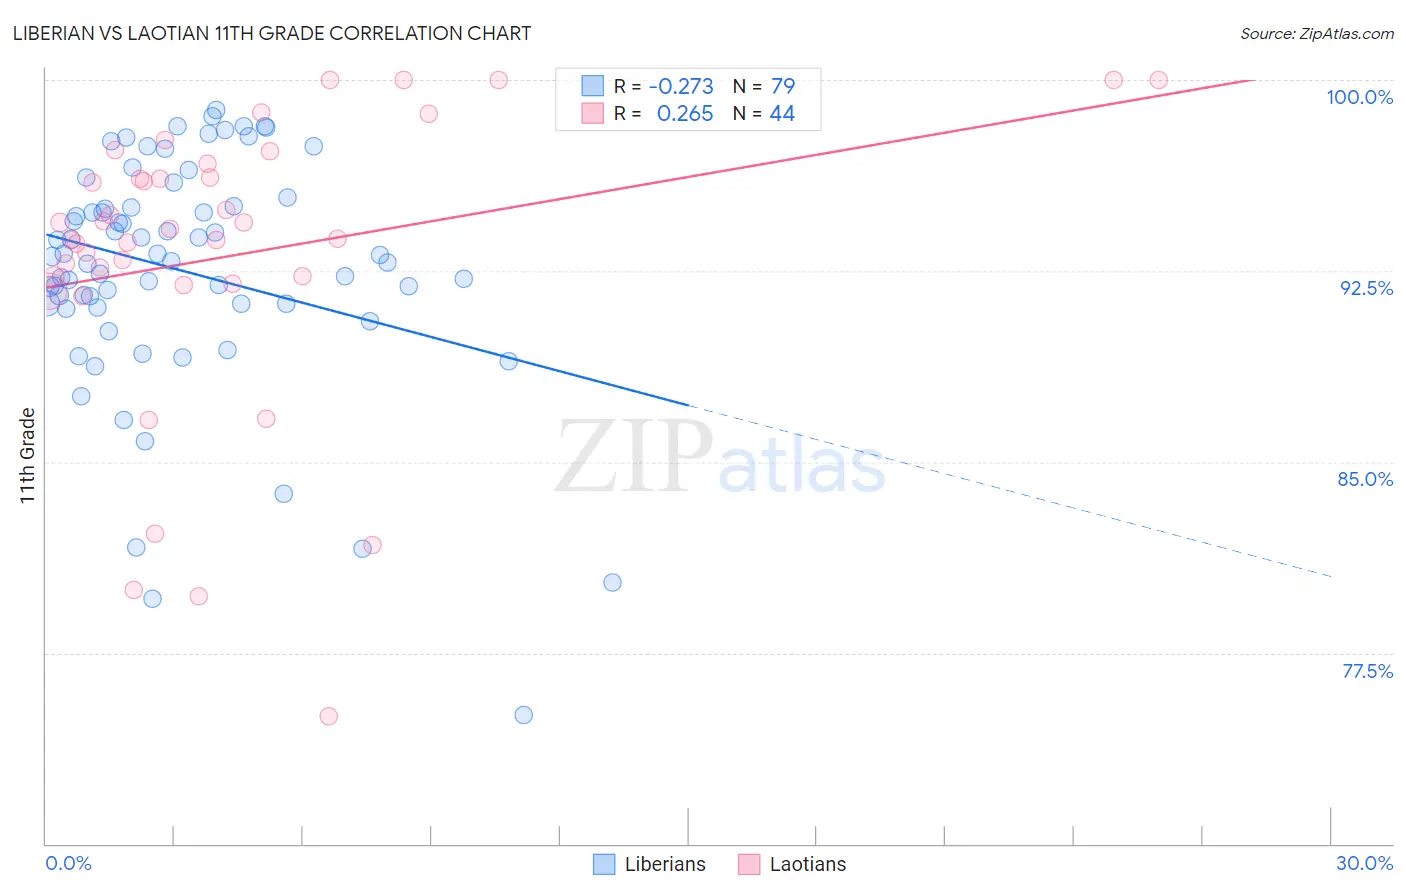
Liberian vs Laotian 11th Grade Correlation Chart
The statistical analysis conducted on geographies consisting of 118,101,728 people shows a weak negative correlation between the proportion of Liberians and percentage of population with at least 11th grade education in the United States with a correlation coefficient (R) of -0.273 and weighted average of 92.3%. Similarly, the statistical analysis conducted on geographies consisting of 224,854,130 people shows a weak positive correlation between the proportion of Laotians and percentage of population with at least 11th grade education in the United States with a correlation coefficient (R) of 0.265 and weighted average of 92.6%, a difference of 0.29%.
11th Grade Correlation Summary
| Measurement | Liberian | Laotian |
| Minimum | 75.1% | 75.0% |
| Maximum | 98.8% | 100.0% |
| Range | 23.7% | 25.0% |
| Mean | 92.5% | 93.1% |
| Median | 93.1% | 93.9% |
| Interquartile 25% (IQ1) | 91.2% | 92.1% |
| Interquartile 75% (IQ3) | 95.1% | 96.4% |
| Interquartile Range (IQR) | 3.8% | 4.3% |
| Standard Deviation (Sample) | 4.6% | 5.8% |
| Standard Deviation (Population) | 4.6% | 5.7% |
Similar Demographics by 11th Grade
Demographics Similar to Liberians by 11th Grade
In terms of 11th grade, the demographic groups most similar to Liberians are Panamanian (92.3%, a difference of 0.010%), Marshallese (92.3%, a difference of 0.010%), Moroccan (92.3%, a difference of 0.020%), Sioux (92.3%, a difference of 0.020%), and Hawaiian (92.3%, a difference of 0.020%).
| Demographics | Rating | Rank | 11th Grade |
| Immigrants | Indonesia | 33.7 /100 | #188 | Fair 92.4% |
| Immigrants | Chile | 33.3 /100 | #189 | Fair 92.4% |
| Chickasaw | 31.4 /100 | #190 | Fair 92.3% |
| French American Indians | 30.8 /100 | #191 | Fair 92.3% |
| Immigrants | Syria | 30.4 /100 | #192 | Fair 92.3% |
| Moroccans | 28.7 /100 | #193 | Fair 92.3% |
| Sioux | 28.5 /100 | #194 | Fair 92.3% |
| Liberians | 26.8 /100 | #195 | Fair 92.3% |
| Panamanians | 26.4 /100 | #196 | Fair 92.3% |
| Marshallese | 26.0 /100 | #197 | Fair 92.3% |
| Hawaiians | 25.5 /100 | #198 | Fair 92.3% |
| Immigrants | Uganda | 25.2 /100 | #199 | Fair 92.3% |
| Samoans | 25.1 /100 | #200 | Fair 92.3% |
| Immigrants | China | 25.1 /100 | #201 | Fair 92.3% |
| Immigrants | Eastern Africa | 24.1 /100 | #202 | Fair 92.3% |
Demographics Similar to Laotians by 11th Grade
In terms of 11th grade, the demographic groups most similar to Laotians are Immigrants from Pakistan (92.5%, a difference of 0.020%), Immigrants from Albania (92.6%, a difference of 0.030%), Immigrants from Northern Africa (92.6%, a difference of 0.030%), Indian (Asian) (92.5%, a difference of 0.030%), and Sierra Leonean (92.6%, a difference of 0.040%).
| Demographics | Rating | Rank | 11th Grade |
| Spanish | 66.2 /100 | #164 | Good 92.7% |
| Immigrants | Iraq | 63.7 /100 | #165 | Good 92.6% |
| Bermudans | 62.3 /100 | #166 | Good 92.6% |
| Alsatians | 60.2 /100 | #167 | Good 92.6% |
| Sierra Leoneans | 58.7 /100 | #168 | Average 92.6% |
| Immigrants | Albania | 57.8 /100 | #169 | Average 92.6% |
| Immigrants | Northern Africa | 57.3 /100 | #170 | Average 92.6% |
| Laotians | 54.4 /100 | #171 | Average 92.6% |
| Immigrants | Pakistan | 52.3 /100 | #172 | Average 92.5% |
| Indians (Asian) | 51.5 /100 | #173 | Average 92.5% |
| Asians | 50.0 /100 | #174 | Average 92.5% |
| Shoshone | 48.9 /100 | #175 | Average 92.5% |
| Spaniards | 46.9 /100 | #176 | Average 92.5% |
| Guamanians/Chamorros | 45.0 /100 | #177 | Average 92.5% |
| Sudanese | 43.4 /100 | #178 | Average 92.5% |