Liberian vs Immigrants from North Macedonia Average Family Size
COMPARE
Liberian
Immigrants from North Macedonia
Average Family Size
Average Family Size Comparison
Liberians
Immigrants from North Macedonia
3.25
AVERAGE FAMILY SIZE
81.2/ 100
METRIC RATING
142nd/ 347
METRIC RANK
3.16
AVERAGE FAMILY SIZE
1.3/ 100
METRIC RATING
261st/ 347
METRIC RANK
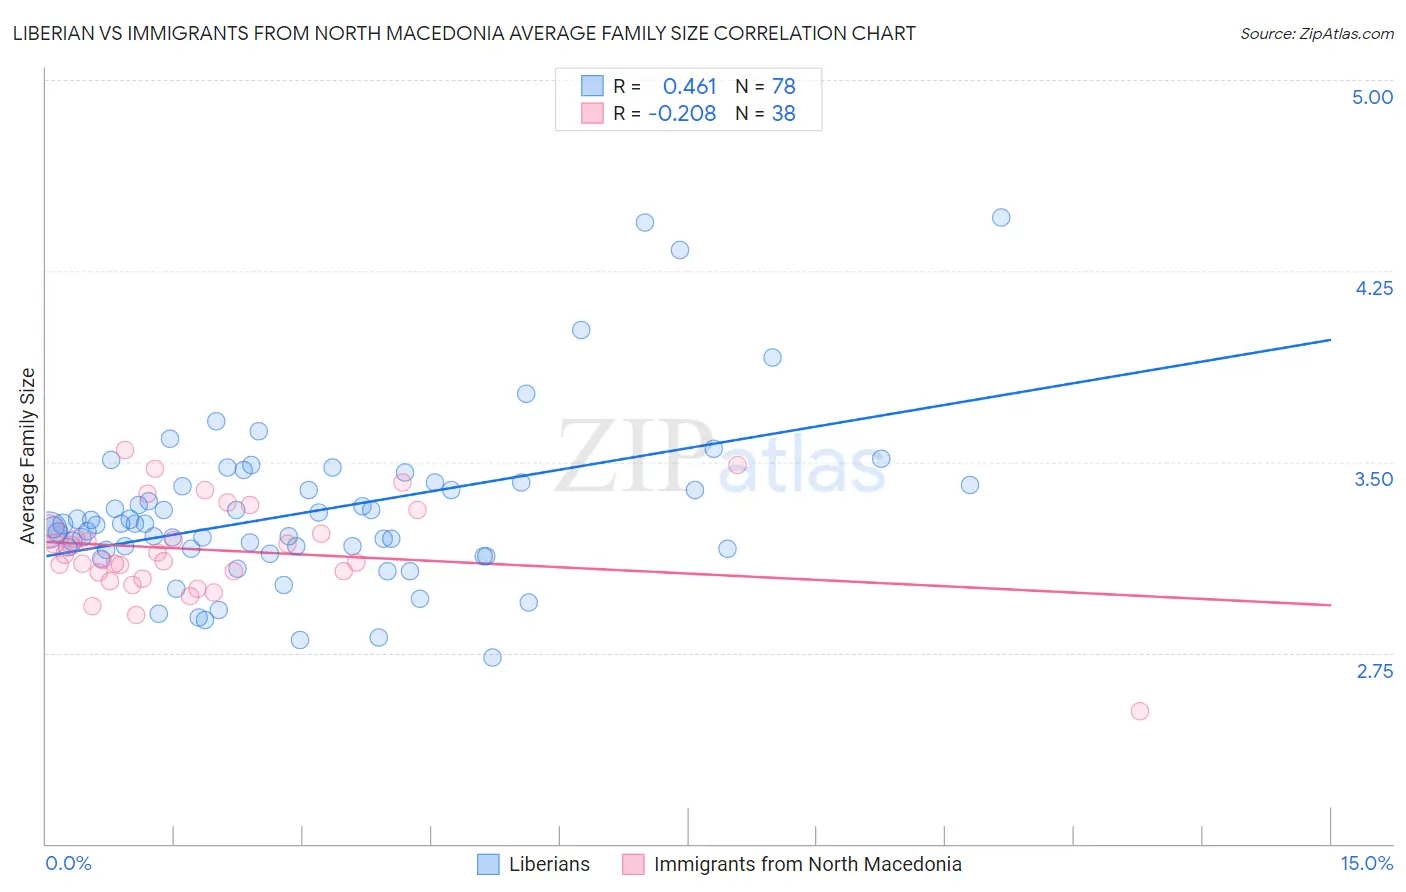
Liberian vs Immigrants from North Macedonia Average Family Size Correlation Chart
The statistical analysis conducted on geographies consisting of 118,032,364 people shows a moderate positive correlation between the proportion of Liberians and average family size in the United States with a correlation coefficient (R) of 0.461 and weighted average of 3.25. Similarly, the statistical analysis conducted on geographies consisting of 74,306,697 people shows a weak negative correlation between the proportion of Immigrants from North Macedonia and average family size in the United States with a correlation coefficient (R) of -0.208 and weighted average of 3.16, a difference of 2.7%.
Average Family Size Correlation Summary
| Measurement | Liberian | Immigrants from North Macedonia |
| Minimum | 2.73 | 2.52 |
| Maximum | 4.46 | 3.55 |
| Range | 1.73 | 1.03 |
| Mean | 3.30 | 3.15 |
| Median | 3.25 | 3.13 |
| Interquartile 25% (IQ1) | 3.16 | 3.07 |
| Interquartile 75% (IQ3) | 3.41 | 3.23 |
| Interquartile Range (IQR) | 0.25 | 0.16 |
| Standard Deviation (Sample) | 0.32 | 0.19 |
| Standard Deviation (Population) | 0.32 | 0.19 |
Similar Demographics by Average Family Size
Demographics Similar to Liberians by Average Family Size
In terms of average family size, the demographic groups most similar to Liberians are Immigrants from Ethiopia (3.25, a difference of 0.010%), Subsaharan African (3.25, a difference of 0.010%), Venezuelan (3.25, a difference of 0.010%), Bhutanese (3.25, a difference of 0.010%), and Cuban (3.25, a difference of 0.020%).
| Demographics | Rating | Rank | Average Family Size |
| Panamanians | 84.2 /100 | #135 | Excellent 3.25 |
| Comanche | 82.8 /100 | #136 | Excellent 3.25 |
| Immigrants | Middle Africa | 82.4 /100 | #137 | Excellent 3.25 |
| Cubans | 81.8 /100 | #138 | Excellent 3.25 |
| Immigrants | Ethiopia | 81.6 /100 | #139 | Excellent 3.25 |
| Sub-Saharan Africans | 81.6 /100 | #140 | Excellent 3.25 |
| Venezuelans | 81.4 /100 | #141 | Excellent 3.25 |
| Liberians | 81.2 /100 | #142 | Excellent 3.25 |
| Bhutanese | 81.0 /100 | #143 | Excellent 3.25 |
| Tsimshian | 80.2 /100 | #144 | Excellent 3.25 |
| Armenians | 78.2 /100 | #145 | Good 3.25 |
| Immigrants | Africa | 77.9 /100 | #146 | Good 3.25 |
| Immigrants | Jordan | 75.7 /100 | #147 | Good 3.24 |
| Blackfeet | 75.0 /100 | #148 | Good 3.24 |
| Assyrians/Chaldeans/Syriacs | 73.8 /100 | #149 | Good 3.24 |
Demographics Similar to Immigrants from North Macedonia by Average Family Size
In terms of average family size, the demographic groups most similar to Immigrants from North Macedonia are Turkish (3.16, a difference of 0.010%), Potawatomi (3.16, a difference of 0.010%), Immigrants from Albania (3.16, a difference of 0.010%), Immigrants from Russia (3.16, a difference of 0.010%), and Albanian (3.17, a difference of 0.060%).
| Demographics | Rating | Rank | Average Family Size |
| Immigrants | Hungary | 1.7 /100 | #254 | Tragic 3.17 |
| Cape Verdeans | 1.6 /100 | #255 | Tragic 3.17 |
| Immigrants | Kazakhstan | 1.5 /100 | #256 | Tragic 3.17 |
| Albanians | 1.5 /100 | #257 | Tragic 3.17 |
| Turks | 1.3 /100 | #258 | Tragic 3.16 |
| Potawatomi | 1.3 /100 | #259 | Tragic 3.16 |
| Immigrants | Albania | 1.3 /100 | #260 | Tragic 3.16 |
| Immigrants | North Macedonia | 1.3 /100 | #261 | Tragic 3.16 |
| Immigrants | Russia | 1.3 /100 | #262 | Tragic 3.16 |
| Immigrants | Bulgaria | 1.0 /100 | #263 | Tragic 3.16 |
| Americans | 1.0 /100 | #264 | Tragic 3.16 |
| Immigrants | South Africa | 0.9 /100 | #265 | Tragic 3.16 |
| Immigrants | Greece | 0.9 /100 | #266 | Tragic 3.16 |
| Iroquois | 0.8 /100 | #267 | Tragic 3.16 |
| Maltese | 0.8 /100 | #268 | Tragic 3.16 |