Lebanese vs Eastern European Births to Unmarried Women
COMPARE
Lebanese
Eastern European
Births to Unmarried Women
Births to Unmarried Women Comparison
Lebanese
Eastern Europeans
29.5%
BIRTHS TO UNMARRIED WOMEN
94.4/ 100
METRIC RATING
103rd/ 347
METRIC RANK
27.7%
BIRTHS TO UNMARRIED WOMEN
99.5/ 100
METRIC RATING
48th/ 347
METRIC RANK
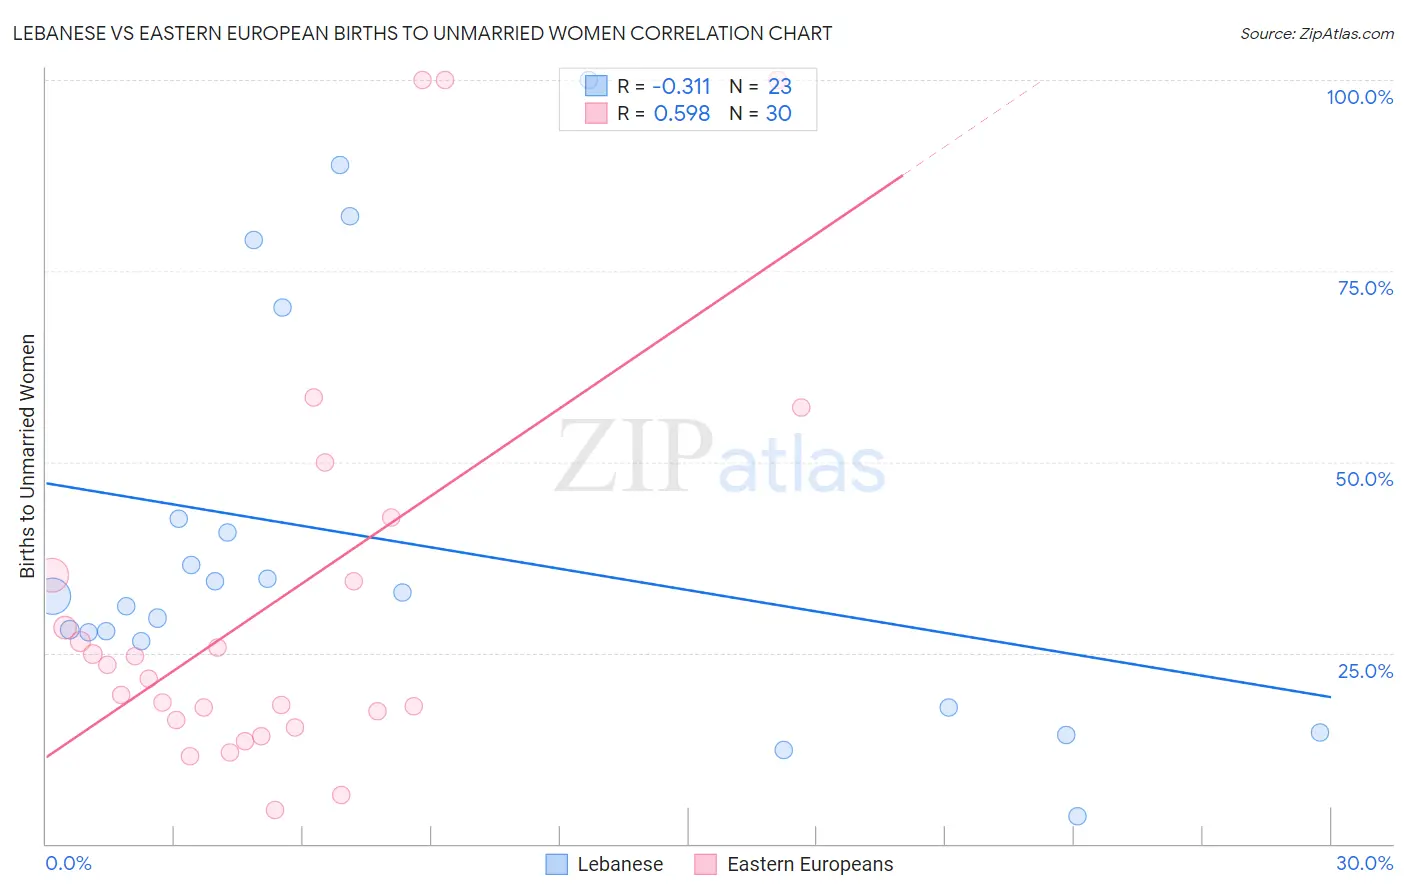
Lebanese vs Eastern European Births to Unmarried Women Correlation Chart
The statistical analysis conducted on geographies consisting of 372,610,698 people shows a mild negative correlation between the proportion of Lebanese and percentage of births to unmarried women in the United States with a correlation coefficient (R) of -0.311 and weighted average of 29.5%. Similarly, the statistical analysis conducted on geographies consisting of 419,649,713 people shows a substantial positive correlation between the proportion of Eastern Europeans and percentage of births to unmarried women in the United States with a correlation coefficient (R) of 0.598 and weighted average of 27.7%, a difference of 6.5%.
Births to Unmarried Women Correlation Summary
| Measurement | Lebanese | Eastern European |
| Minimum | 3.6% | 4.4% |
| Maximum | 100.0% | 100.0% |
| Range | 96.4% | 95.6% |
| Mean | 39.5% | 31.8% |
| Median | 32.4% | 22.6% |
| Interquartile 25% (IQ1) | 26.4% | 16.3% |
| Interquartile 75% (IQ3) | 42.6% | 35.2% |
| Interquartile Range (IQR) | 16.2% | 18.9% |
| Standard Deviation (Sample) | 26.2% | 26.7% |
| Standard Deviation (Population) | 25.6% | 26.2% |
Similar Demographics by Births to Unmarried Women
Demographics Similar to Lebanese by Births to Unmarried Women
In terms of births to unmarried women, the demographic groups most similar to Lebanese are Lithuanian (29.6%, a difference of 0.010%), Australian (29.5%, a difference of 0.050%), Immigrants from Nepal (29.6%, a difference of 0.060%), Immigrants from Northern Africa (29.5%, a difference of 0.13%), and Swedish (29.6%, a difference of 0.32%).
| Demographics | Rating | Rank | Births to Unmarried Women |
| Norwegians | 95.8 /100 | #96 | Exceptional 29.3% |
| Immigrants | South Africa | 95.7 /100 | #97 | Exceptional 29.3% |
| Immigrants | Syria | 95.7 /100 | #98 | Exceptional 29.4% |
| Immigrants | Denmark | 95.3 /100 | #99 | Exceptional 29.4% |
| Luxembourgers | 95.2 /100 | #100 | Exceptional 29.4% |
| Immigrants | Northern Africa | 94.7 /100 | #101 | Exceptional 29.5% |
| Australians | 94.6 /100 | #102 | Exceptional 29.5% |
| Lebanese | 94.4 /100 | #103 | Exceptional 29.5% |
| Lithuanians | 94.4 /100 | #104 | Exceptional 29.6% |
| Immigrants | Nepal | 94.3 /100 | #105 | Exceptional 29.6% |
| Swedes | 93.8 /100 | #106 | Exceptional 29.6% |
| Immigrants | Brazil | 93.7 /100 | #107 | Exceptional 29.6% |
| Paraguayans | 93.5 /100 | #108 | Exceptional 29.7% |
| Greeks | 93.4 /100 | #109 | Exceptional 29.7% |
| Immigrants | Ethiopia | 93.4 /100 | #110 | Exceptional 29.7% |
Demographics Similar to Eastern Europeans by Births to Unmarried Women
In terms of births to unmarried women, the demographic groups most similar to Eastern Europeans are Immigrants from Lithuania (27.7%, a difference of 0.010%), Hmong (27.7%, a difference of 0.010%), Latvian (27.7%, a difference of 0.060%), Immigrants from Indonesia (27.7%, a difference of 0.15%), and Immigrants from Greece (27.8%, a difference of 0.19%).
| Demographics | Rating | Rank | Births to Unmarried Women |
| Iraqis | 99.6 /100 | #41 | Exceptional 27.6% |
| Immigrants | Eastern Europe | 99.6 /100 | #42 | Exceptional 27.6% |
| Immigrants | Bulgaria | 99.6 /100 | #43 | Exceptional 27.6% |
| Immigrants | Indonesia | 99.5 /100 | #44 | Exceptional 27.7% |
| Latvians | 99.5 /100 | #45 | Exceptional 27.7% |
| Immigrants | Lithuania | 99.5 /100 | #46 | Exceptional 27.7% |
| Hmong | 99.5 /100 | #47 | Exceptional 27.7% |
| Eastern Europeans | 99.5 /100 | #48 | Exceptional 27.7% |
| Immigrants | Greece | 99.4 /100 | #49 | Exceptional 27.8% |
| Maltese | 99.4 /100 | #50 | Exceptional 27.8% |
| Macedonians | 99.4 /100 | #51 | Exceptional 27.9% |
| Bhutanese | 99.4 /100 | #52 | Exceptional 27.9% |
| Immigrants | Romania | 99.4 /100 | #53 | Exceptional 27.9% |
| Afghans | 99.4 /100 | #54 | Exceptional 27.9% |
| Mongolians | 99.3 /100 | #55 | Exceptional 27.9% |