Lebanese vs Immigrants from North Macedonia Births to Unmarried Women
COMPARE
Lebanese
Immigrants from North Macedonia
Births to Unmarried Women
Births to Unmarried Women Comparison
Lebanese
Immigrants from North Macedonia
29.5%
BIRTHS TO UNMARRIED WOMEN
94.4/ 100
METRIC RATING
103rd/ 347
METRIC RANK
28.1%
BIRTHS TO UNMARRIED WOMEN
99.1/ 100
METRIC RATING
61st/ 347
METRIC RANK
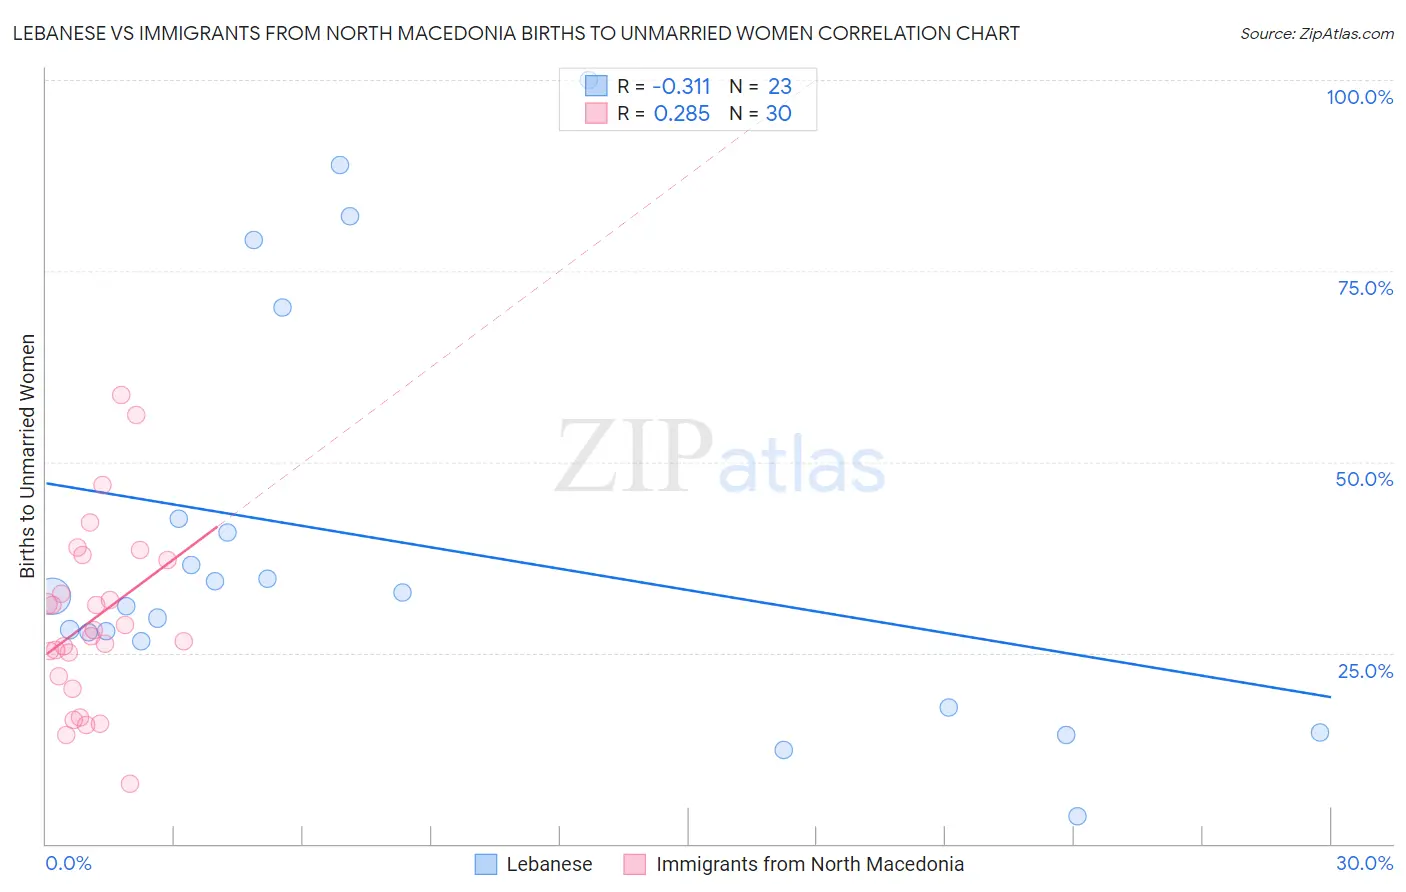
Lebanese vs Immigrants from North Macedonia Births to Unmarried Women Correlation Chart
The statistical analysis conducted on geographies consisting of 372,610,698 people shows a mild negative correlation between the proportion of Lebanese and percentage of births to unmarried women in the United States with a correlation coefficient (R) of -0.311 and weighted average of 29.5%. Similarly, the statistical analysis conducted on geographies consisting of 71,828,826 people shows a weak positive correlation between the proportion of Immigrants from North Macedonia and percentage of births to unmarried women in the United States with a correlation coefficient (R) of 0.285 and weighted average of 28.1%, a difference of 5.0%.
Births to Unmarried Women Correlation Summary
| Measurement | Lebanese | Immigrants from North Macedonia |
| Minimum | 3.6% | 7.8% |
| Maximum | 100.0% | 58.8% |
| Range | 96.4% | 51.0% |
| Mean | 39.5% | 29.4% |
| Median | 32.4% | 27.6% |
| Interquartile 25% (IQ1) | 26.4% | 22.0% |
| Interquartile 75% (IQ3) | 42.6% | 37.2% |
| Interquartile Range (IQR) | 16.2% | 15.2% |
| Standard Deviation (Sample) | 26.2% | 11.8% |
| Standard Deviation (Population) | 25.6% | 11.6% |
Similar Demographics by Births to Unmarried Women
Demographics Similar to Lebanese by Births to Unmarried Women
In terms of births to unmarried women, the demographic groups most similar to Lebanese are Lithuanian (29.6%, a difference of 0.010%), Australian (29.5%, a difference of 0.050%), Immigrants from Nepal (29.6%, a difference of 0.060%), Immigrants from Northern Africa (29.5%, a difference of 0.13%), and Swedish (29.6%, a difference of 0.32%).
| Demographics | Rating | Rank | Births to Unmarried Women |
| Norwegians | 95.8 /100 | #96 | Exceptional 29.3% |
| Immigrants | South Africa | 95.7 /100 | #97 | Exceptional 29.3% |
| Immigrants | Syria | 95.7 /100 | #98 | Exceptional 29.4% |
| Immigrants | Denmark | 95.3 /100 | #99 | Exceptional 29.4% |
| Luxembourgers | 95.2 /100 | #100 | Exceptional 29.4% |
| Immigrants | Northern Africa | 94.7 /100 | #101 | Exceptional 29.5% |
| Australians | 94.6 /100 | #102 | Exceptional 29.5% |
| Lebanese | 94.4 /100 | #103 | Exceptional 29.5% |
| Lithuanians | 94.4 /100 | #104 | Exceptional 29.6% |
| Immigrants | Nepal | 94.3 /100 | #105 | Exceptional 29.6% |
| Swedes | 93.8 /100 | #106 | Exceptional 29.6% |
| Immigrants | Brazil | 93.7 /100 | #107 | Exceptional 29.6% |
| Paraguayans | 93.5 /100 | #108 | Exceptional 29.7% |
| Greeks | 93.4 /100 | #109 | Exceptional 29.7% |
| Immigrants | Ethiopia | 93.4 /100 | #110 | Exceptional 29.7% |
Demographics Similar to Immigrants from North Macedonia by Births to Unmarried Women
In terms of births to unmarried women, the demographic groups most similar to Immigrants from North Macedonia are Immigrants from Turkey (28.1%, a difference of 0.040%), Immigrants from Kazakhstan (28.1%, a difference of 0.090%), Egyptian (28.2%, a difference of 0.32%), Immigrants from Albania (28.0%, a difference of 0.34%), and Russian (28.0%, a difference of 0.45%).
| Demographics | Rating | Rank | Births to Unmarried Women |
| Afghans | 99.4 /100 | #54 | Exceptional 27.9% |
| Mongolians | 99.3 /100 | #55 | Exceptional 27.9% |
| Immigrants | Belgium | 99.3 /100 | #56 | Exceptional 28.0% |
| Russians | 99.2 /100 | #57 | Exceptional 28.0% |
| Immigrants | Albania | 99.2 /100 | #58 | Exceptional 28.0% |
| Immigrants | Kazakhstan | 99.1 /100 | #59 | Exceptional 28.1% |
| Immigrants | Turkey | 99.1 /100 | #60 | Exceptional 28.1% |
| Immigrants | North Macedonia | 99.1 /100 | #61 | Exceptional 28.1% |
| Egyptians | 99.0 /100 | #62 | Exceptional 28.2% |
| Immigrants | Serbia | 98.9 /100 | #63 | Exceptional 28.3% |
| Tongans | 98.8 /100 | #64 | Exceptional 28.4% |
| Immigrants | Czechoslovakia | 98.8 /100 | #65 | Exceptional 28.4% |
| Immigrants | Egypt | 98.8 /100 | #66 | Exceptional 28.4% |
| Palestinians | 98.7 /100 | #67 | Exceptional 28.4% |
| Immigrants | Europe | 98.7 /100 | #68 | Exceptional 28.4% |