Latvian vs Immigrants from Turkey Single Mother Households
COMPARE
Latvian
Immigrants from Turkey
Single Mother Households
Single Mother Households Comparison
Latvians
Immigrants from Turkey
5.3%
SINGLE MOTHER HOUSEHOLDS
99.7/ 100
METRIC RATING
29th/ 347
METRIC RANK
5.7%
SINGLE MOTHER HOUSEHOLDS
97.5/ 100
METRIC RATING
87th/ 347
METRIC RANK
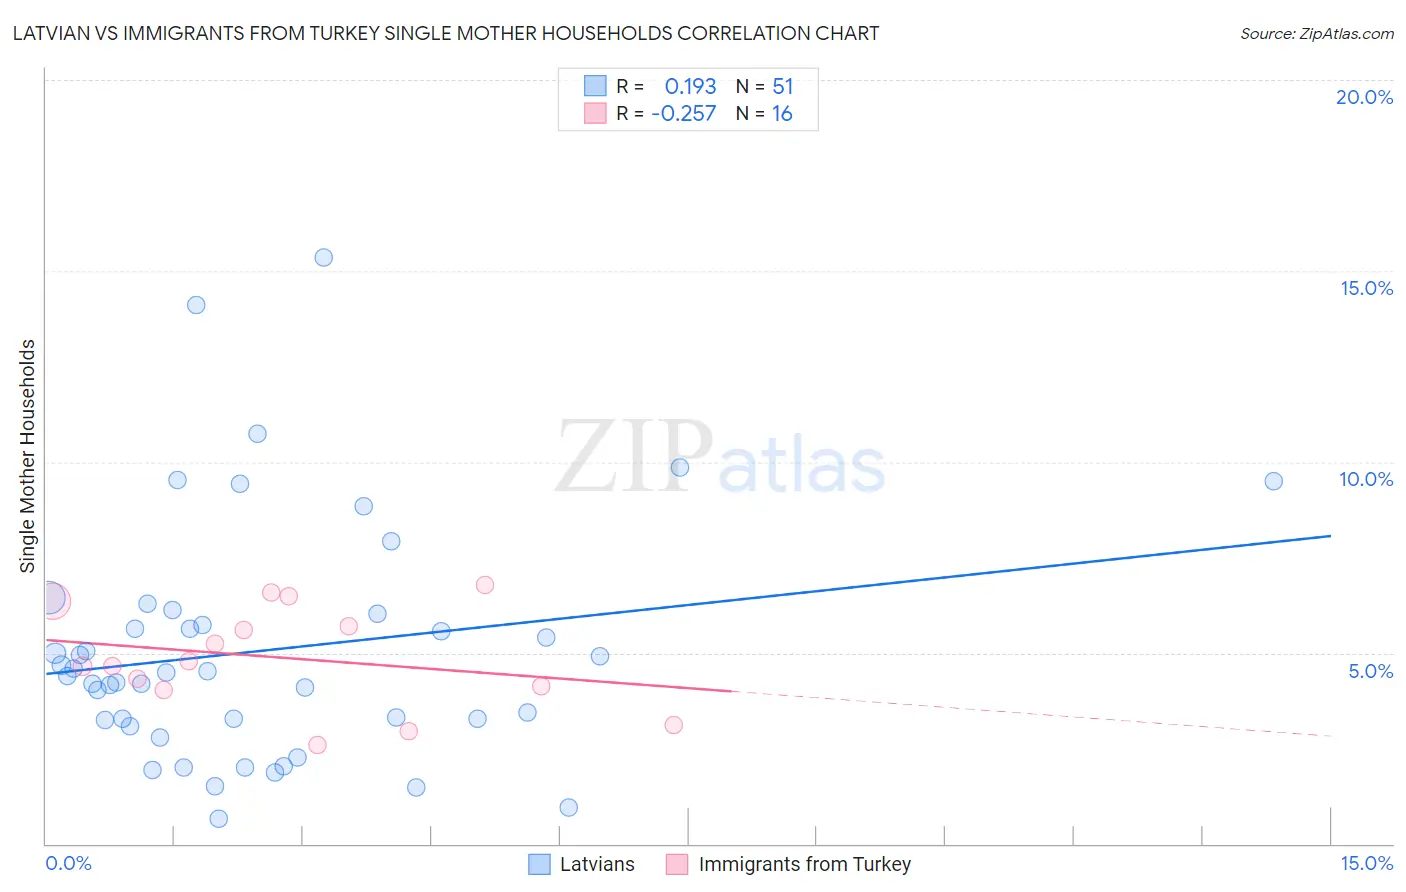
Latvian vs Immigrants from Turkey Single Mother Households Correlation Chart
The statistical analysis conducted on geographies consisting of 220,091,303 people shows a poor positive correlation between the proportion of Latvians and percentage of single mother households in the United States with a correlation coefficient (R) of 0.193 and weighted average of 5.3%. Similarly, the statistical analysis conducted on geographies consisting of 222,703,897 people shows a weak negative correlation between the proportion of Immigrants from Turkey and percentage of single mother households in the United States with a correlation coefficient (R) of -0.257 and weighted average of 5.7%, a difference of 7.5%.
Single Mother Households Correlation Summary
| Measurement | Latvian | Immigrants from Turkey |
| Minimum | 0.66% | 2.6% |
| Maximum | 15.3% | 6.8% |
| Range | 14.7% | 4.2% |
| Mean | 5.1% | 4.9% |
| Median | 4.5% | 4.7% |
| Interquartile 25% (IQ1) | 3.3% | 4.1% |
| Interquartile 75% (IQ3) | 6.0% | 6.0% |
| Interquartile Range (IQR) | 2.8% | 1.9% |
| Standard Deviation (Sample) | 3.1% | 1.3% |
| Standard Deviation (Population) | 3.1% | 1.3% |
Similar Demographics by Single Mother Households
Demographics Similar to Latvians by Single Mother Households
In terms of single mother households, the demographic groups most similar to Latvians are Russian (5.3%, a difference of 0.010%), Burmese (5.3%, a difference of 0.060%), Immigrants from Korea (5.3%, a difference of 0.070%), Cambodian (5.3%, a difference of 0.070%), and Bhutanese (5.3%, a difference of 0.12%).
| Demographics | Rating | Rank | Single Mother Households |
| Thais | 99.8 /100 | #22 | Exceptional 5.2% |
| Immigrants | Austria | 99.8 /100 | #23 | Exceptional 5.2% |
| Armenians | 99.8 /100 | #24 | Exceptional 5.2% |
| Immigrants | Japan | 99.8 /100 | #25 | Exceptional 5.2% |
| Immigrants | Lithuania | 99.8 /100 | #26 | Exceptional 5.3% |
| Bhutanese | 99.7 /100 | #27 | Exceptional 5.3% |
| Russians | 99.7 /100 | #28 | Exceptional 5.3% |
| Latvians | 99.7 /100 | #29 | Exceptional 5.3% |
| Burmese | 99.7 /100 | #30 | Exceptional 5.3% |
| Immigrants | Korea | 99.7 /100 | #31 | Exceptional 5.3% |
| Cambodians | 99.7 /100 | #32 | Exceptional 5.3% |
| Immigrants | Switzerland | 99.7 /100 | #33 | Exceptional 5.3% |
| Bulgarians | 99.7 /100 | #34 | Exceptional 5.3% |
| Immigrants | Northern Europe | 99.7 /100 | #35 | Exceptional 5.3% |
| Immigrants | Czechoslovakia | 99.7 /100 | #36 | Exceptional 5.3% |
Demographics Similar to Immigrants from Turkey by Single Mother Households
In terms of single mother households, the demographic groups most similar to Immigrants from Turkey are Israeli (5.7%, a difference of 0.070%), Finnish (5.7%, a difference of 0.080%), Hungarian (5.7%, a difference of 0.11%), Carpatho Rusyn (5.7%, a difference of 0.26%), and Ukrainian (5.7%, a difference of 0.33%).
| Demographics | Rating | Rank | Single Mother Households |
| Czechs | 97.9 /100 | #80 | Exceptional 5.6% |
| Immigrants | Moldova | 97.9 /100 | #81 | Exceptional 5.6% |
| Immigrants | Malaysia | 97.8 /100 | #82 | Exceptional 5.7% |
| Immigrants | Hungary | 97.8 /100 | #83 | Exceptional 5.7% |
| Carpatho Rusyns | 97.7 /100 | #84 | Exceptional 5.7% |
| Hungarians | 97.6 /100 | #85 | Exceptional 5.7% |
| Finns | 97.6 /100 | #86 | Exceptional 5.7% |
| Immigrants | Turkey | 97.5 /100 | #87 | Exceptional 5.7% |
| Israelis | 97.4 /100 | #88 | Exceptional 5.7% |
| Ukrainians | 97.2 /100 | #89 | Exceptional 5.7% |
| Immigrants | Indonesia | 97.2 /100 | #90 | Exceptional 5.7% |
| Europeans | 97.0 /100 | #91 | Exceptional 5.7% |
| Immigrants | Western Asia | 96.7 /100 | #92 | Exceptional 5.7% |
| Serbians | 96.7 /100 | #93 | Exceptional 5.7% |
| Basques | 96.7 /100 | #94 | Exceptional 5.7% |