Latvian vs Macedonian Single Mother Households
COMPARE
Latvian
Macedonian
Single Mother Households
Single Mother Households Comparison
Latvians
Macedonians
5.3%
SINGLE MOTHER HOUSEHOLDS
99.7/ 100
METRIC RATING
29th/ 347
METRIC RANK
5.4%
SINGLE MOTHER HOUSEHOLDS
99.5/ 100
METRIC RATING
42nd/ 347
METRIC RANK
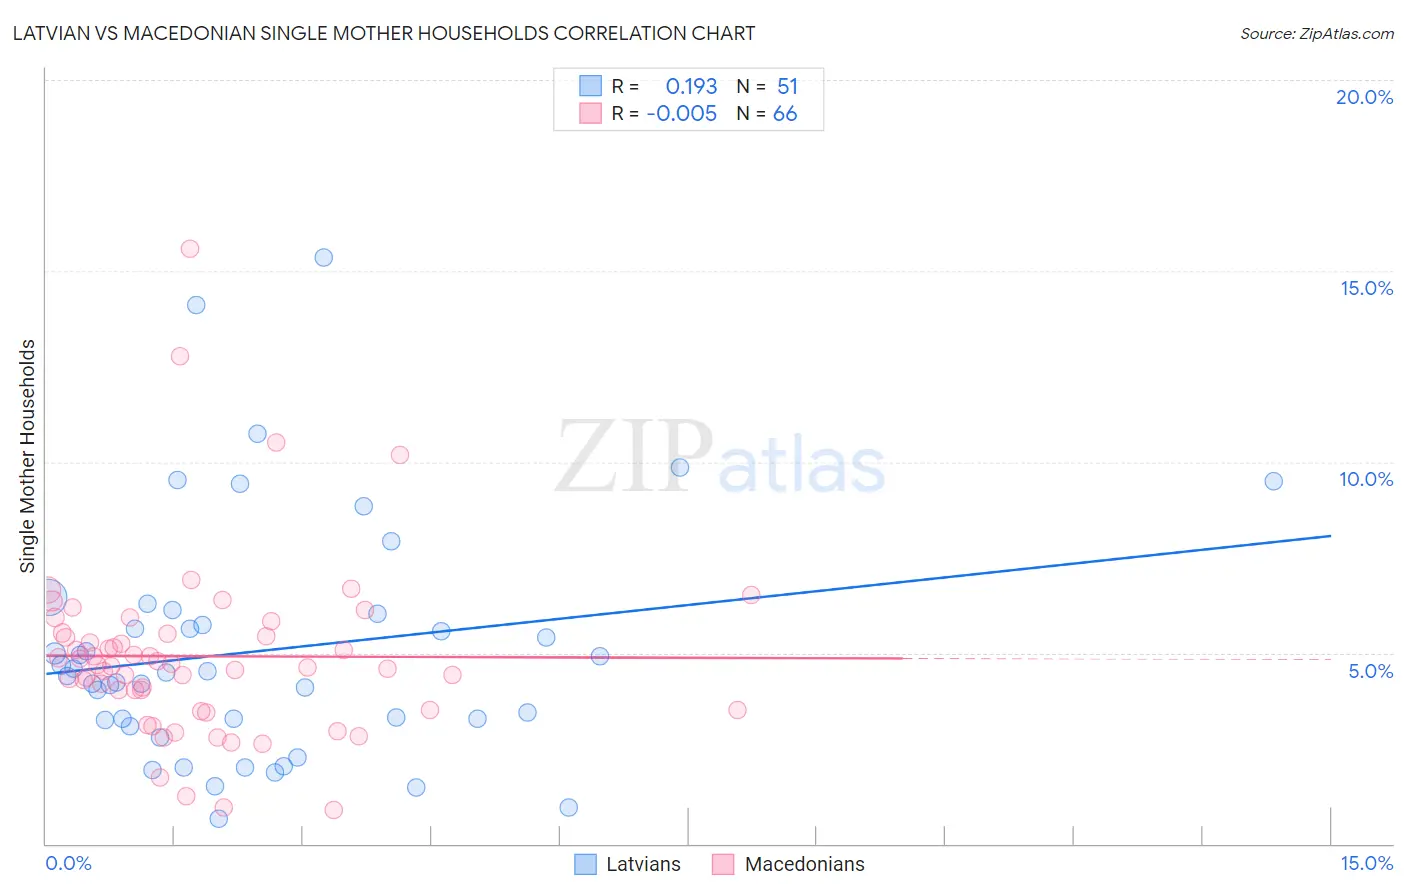
Latvian vs Macedonian Single Mother Households Correlation Chart
The statistical analysis conducted on geographies consisting of 220,091,303 people shows a poor positive correlation between the proportion of Latvians and percentage of single mother households in the United States with a correlation coefficient (R) of 0.193 and weighted average of 5.3%. Similarly, the statistical analysis conducted on geographies consisting of 132,446,504 people shows no correlation between the proportion of Macedonians and percentage of single mother households in the United States with a correlation coefficient (R) of -0.005 and weighted average of 5.4%, a difference of 2.1%.
Single Mother Households Correlation Summary
| Measurement | Latvian | Macedonian |
| Minimum | 0.66% | 0.89% |
| Maximum | 15.3% | 15.6% |
| Range | 14.7% | 14.7% |
| Mean | 5.1% | 4.9% |
| Median | 4.5% | 4.7% |
| Interquartile 25% (IQ1) | 3.3% | 3.5% |
| Interquartile 75% (IQ3) | 6.0% | 5.5% |
| Interquartile Range (IQR) | 2.8% | 2.0% |
| Standard Deviation (Sample) | 3.1% | 2.4% |
| Standard Deviation (Population) | 3.1% | 2.4% |
Demographics Similar to Latvians and Macedonians by Single Mother Households
In terms of single mother households, the demographic groups most similar to Latvians are Russian (5.3%, a difference of 0.010%), Burmese (5.3%, a difference of 0.060%), Immigrants from Korea (5.3%, a difference of 0.070%), Cambodian (5.3%, a difference of 0.070%), and Bhutanese (5.3%, a difference of 0.12%). Similarly, the demographic groups most similar to Macedonians are Immigrants from South Central Asia (5.4%, a difference of 0.060%), Immigrants from Greece (5.4%, a difference of 0.080%), Estonian (5.4%, a difference of 0.50%), Immigrants from Sweden (5.4%, a difference of 0.61%), and Immigrants from Serbia (5.4%, a difference of 0.76%).
| Demographics | Rating | Rank | Single Mother Households |
| Immigrants | Japan | 99.8 /100 | #25 | Exceptional 5.2% |
| Immigrants | Lithuania | 99.8 /100 | #26 | Exceptional 5.3% |
| Bhutanese | 99.7 /100 | #27 | Exceptional 5.3% |
| Russians | 99.7 /100 | #28 | Exceptional 5.3% |
| Latvians | 99.7 /100 | #29 | Exceptional 5.3% |
| Burmese | 99.7 /100 | #30 | Exceptional 5.3% |
| Immigrants | Korea | 99.7 /100 | #31 | Exceptional 5.3% |
| Cambodians | 99.7 /100 | #32 | Exceptional 5.3% |
| Immigrants | Switzerland | 99.7 /100 | #33 | Exceptional 5.3% |
| Bulgarians | 99.7 /100 | #34 | Exceptional 5.3% |
| Immigrants | Northern Europe | 99.7 /100 | #35 | Exceptional 5.3% |
| Immigrants | Czechoslovakia | 99.7 /100 | #36 | Exceptional 5.3% |
| Immigrants | Belgium | 99.7 /100 | #37 | Exceptional 5.3% |
| Immigrants | Serbia | 99.6 /100 | #38 | Exceptional 5.4% |
| Immigrants | Sweden | 99.6 /100 | #39 | Exceptional 5.4% |
| Estonians | 99.6 /100 | #40 | Exceptional 5.4% |
| Immigrants | Greece | 99.5 /100 | #41 | Exceptional 5.4% |
| Macedonians | 99.5 /100 | #42 | Exceptional 5.4% |
| Immigrants | South Central Asia | 99.5 /100 | #43 | Exceptional 5.4% |
| Lithuanians | 99.4 /100 | #44 | Exceptional 5.4% |
| Immigrants | Croatia | 99.4 /100 | #45 | Exceptional 5.4% |