Laotian vs Nicaraguan Single Father Households
COMPARE
Laotian
Nicaraguan
Single Father Households
Single Father Households Comparison
Laotians
Nicaraguans
2.2%
SINGLE FATHER HOUSEHOLDS
92.5/ 100
METRIC RATING
141st/ 347
METRIC RANK
2.6%
SINGLE FATHER HOUSEHOLDS
0.1/ 100
METRIC RATING
281st/ 347
METRIC RANK
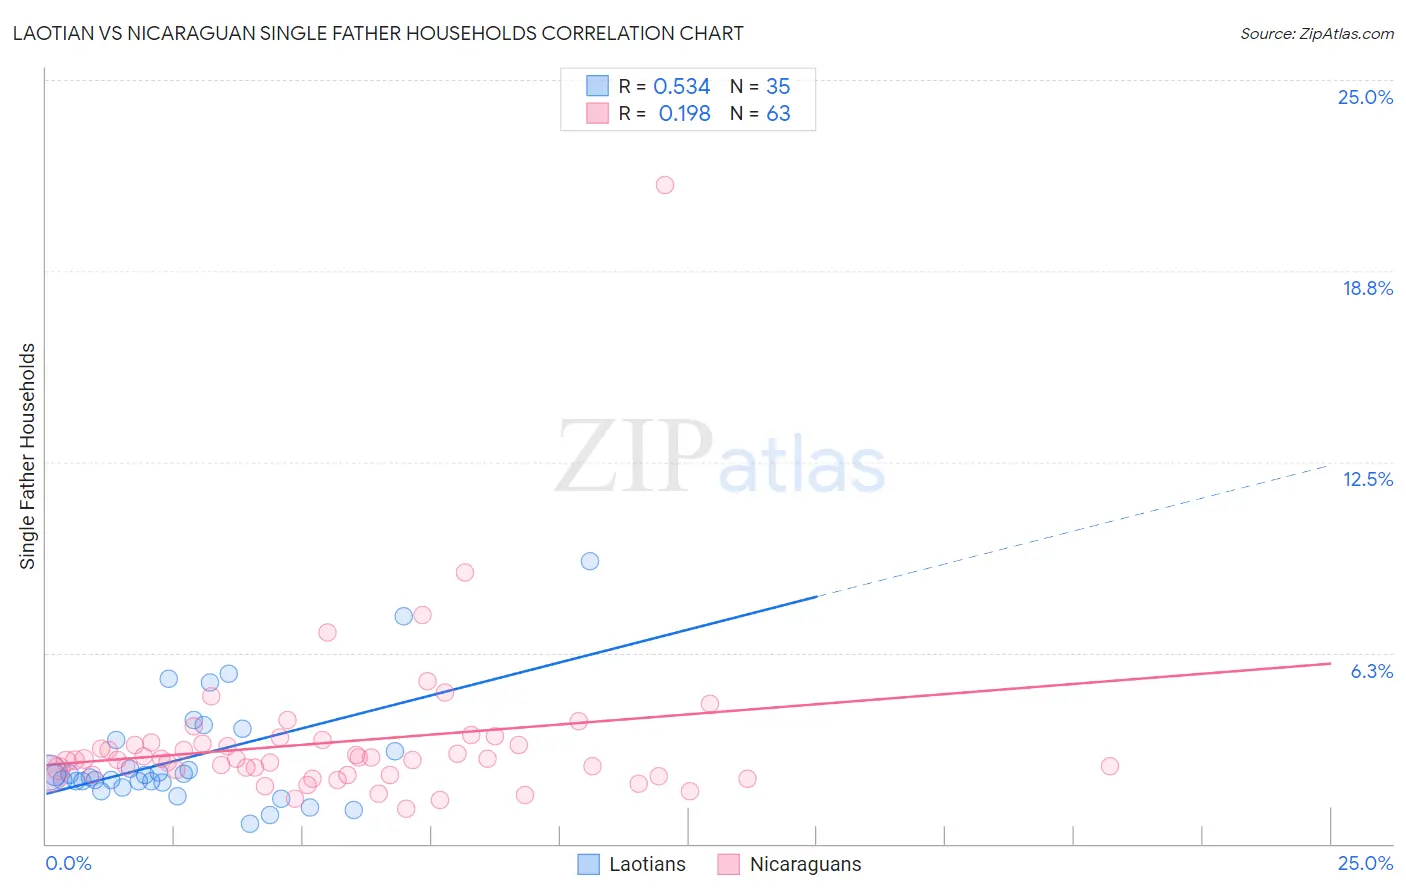
Laotian vs Nicaraguan Single Father Households Correlation Chart
The statistical analysis conducted on geographies consisting of 223,877,457 people shows a substantial positive correlation between the proportion of Laotians and percentage of single father households in the United States with a correlation coefficient (R) of 0.534 and weighted average of 2.2%. Similarly, the statistical analysis conducted on geographies consisting of 284,673,398 people shows a poor positive correlation between the proportion of Nicaraguans and percentage of single father households in the United States with a correlation coefficient (R) of 0.198 and weighted average of 2.6%, a difference of 18.3%.
Single Father Households Correlation Summary
| Measurement | Laotian | Nicaraguan |
| Minimum | 0.67% | 1.1% |
| Maximum | 9.2% | 21.5% |
| Range | 8.6% | 20.4% |
| Mean | 2.8% | 3.3% |
| Median | 2.2% | 2.8% |
| Interquartile 25% (IQ1) | 2.0% | 2.3% |
| Interquartile 75% (IQ3) | 3.4% | 3.3% |
| Interquartile Range (IQR) | 1.4% | 1.0% |
| Standard Deviation (Sample) | 1.8% | 2.7% |
| Standard Deviation (Population) | 1.8% | 2.7% |
Similar Demographics by Single Father Households
Demographics Similar to Laotians by Single Father Households
In terms of single father households, the demographic groups most similar to Laotians are Luxembourger (2.2%, a difference of 0.040%), Brazilian (2.2%, a difference of 0.090%), British (2.2%, a difference of 0.090%), Immigrants from Nepal (2.2%, a difference of 0.10%), and Slovak (2.2%, a difference of 0.44%).
| Demographics | Rating | Rank | Single Father Households |
| Zimbabweans | 95.1 /100 | #134 | Exceptional 2.2% |
| Syrians | 94.8 /100 | #135 | Exceptional 2.2% |
| Chileans | 94.5 /100 | #136 | Exceptional 2.2% |
| Austrians | 94.2 /100 | #137 | Exceptional 2.2% |
| West Indians | 94.1 /100 | #138 | Exceptional 2.2% |
| Brazilians | 92.8 /100 | #139 | Exceptional 2.2% |
| British | 92.8 /100 | #140 | Exceptional 2.2% |
| Laotians | 92.5 /100 | #141 | Exceptional 2.2% |
| Luxembourgers | 92.3 /100 | #142 | Exceptional 2.2% |
| Immigrants | Nepal | 92.1 /100 | #143 | Exceptional 2.2% |
| Slovaks | 90.7 /100 | #144 | Exceptional 2.2% |
| Immigrants | Zimbabwe | 90.2 /100 | #145 | Exceptional 2.2% |
| Northern Europeans | 89.8 /100 | #146 | Excellent 2.2% |
| Slavs | 88.9 /100 | #147 | Excellent 2.2% |
| South American Indians | 88.5 /100 | #148 | Excellent 2.3% |
Demographics Similar to Nicaraguans by Single Father Households
In terms of single father households, the demographic groups most similar to Nicaraguans are Immigrants from Portugal (2.6%, a difference of 0.010%), Dutch West Indian (2.6%, a difference of 0.050%), Samoan (2.6%, a difference of 0.56%), Cherokee (2.6%, a difference of 0.60%), and Shoshone (2.6%, a difference of 0.65%).
| Demographics | Rating | Rank | Single Father Households |
| Puerto Ricans | 0.2 /100 | #274 | Tragic 2.6% |
| Immigrants | Dominican Republic | 0.2 /100 | #275 | Tragic 2.6% |
| Immigrants | Haiti | 0.1 /100 | #276 | Tragic 2.6% |
| Shoshone | 0.1 /100 | #277 | Tragic 2.6% |
| Cherokee | 0.1 /100 | #278 | Tragic 2.6% |
| Samoans | 0.1 /100 | #279 | Tragic 2.6% |
| Immigrants | Portugal | 0.1 /100 | #280 | Tragic 2.6% |
| Nicaraguans | 0.1 /100 | #281 | Tragic 2.6% |
| Dutch West Indians | 0.1 /100 | #282 | Tragic 2.6% |
| Immigrants | Nicaragua | 0.1 /100 | #283 | Tragic 2.7% |
| Hawaiians | 0.1 /100 | #284 | Tragic 2.7% |
| Ottawa | 0.1 /100 | #285 | Tragic 2.7% |
| Immigrants | Cuba | 0.1 /100 | #286 | Tragic 2.7% |
| Central American Indians | 0.0 /100 | #287 | Tragic 2.7% |
| Immigrants | Cambodia | 0.0 /100 | #288 | Tragic 2.7% |