Laotian vs Immigrants from Sri Lanka Single Father Households
COMPARE
Laotian
Immigrants from Sri Lanka
Single Father Households
Single Father Households Comparison
Laotians
Immigrants from Sri Lanka
2.2%
SINGLE FATHER HOUSEHOLDS
92.5/ 100
METRIC RATING
141st/ 347
METRIC RANK
2.0%
SINGLE FATHER HOUSEHOLDS
100.0/ 100
METRIC RATING
39th/ 347
METRIC RANK
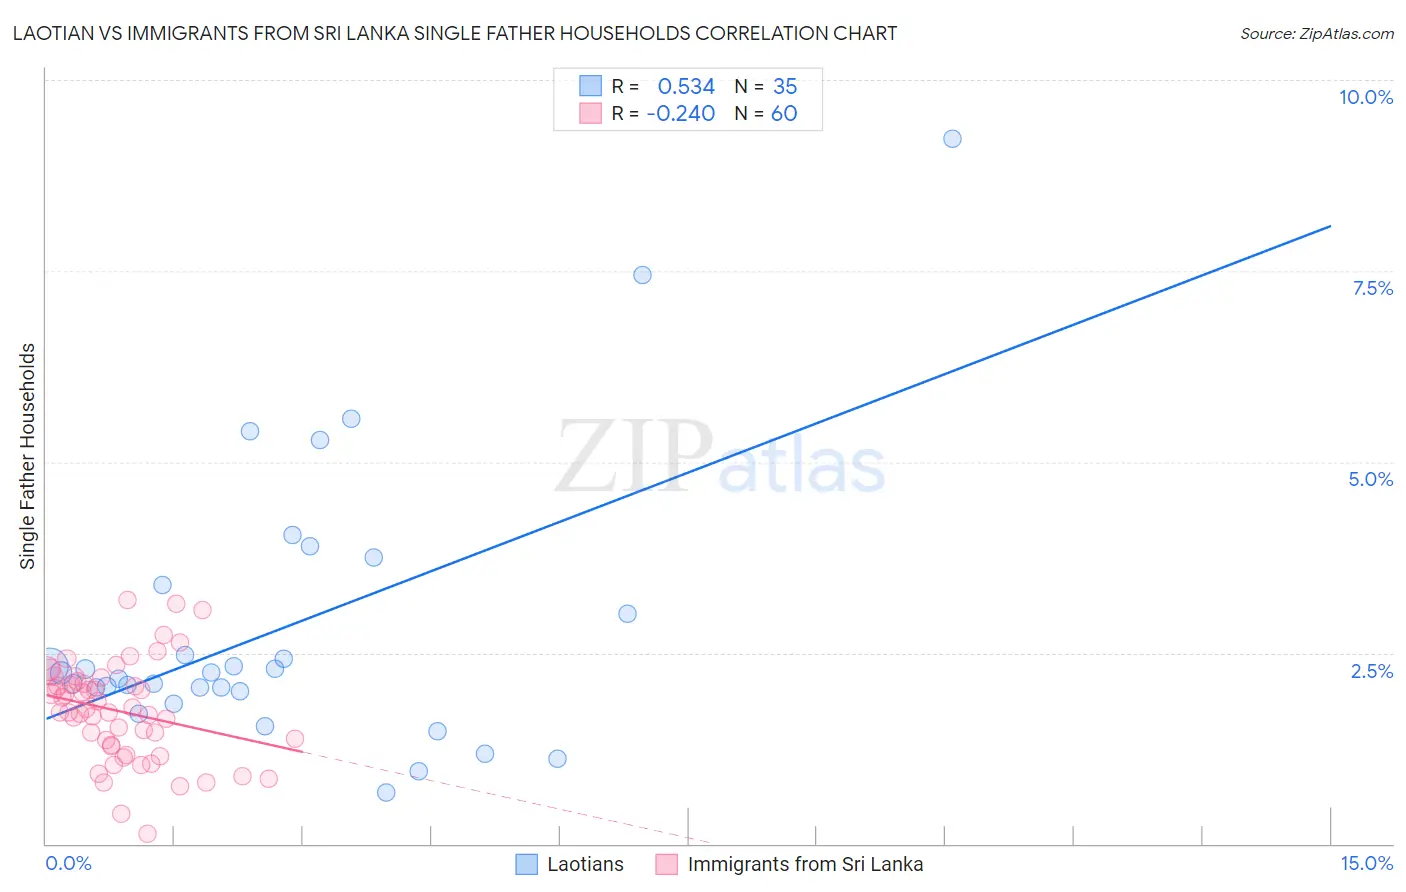
Laotian vs Immigrants from Sri Lanka Single Father Households Correlation Chart
The statistical analysis conducted on geographies consisting of 223,877,457 people shows a substantial positive correlation between the proportion of Laotians and percentage of single father households in the United States with a correlation coefficient (R) of 0.534 and weighted average of 2.2%. Similarly, the statistical analysis conducted on geographies consisting of 149,256,375 people shows a weak negative correlation between the proportion of Immigrants from Sri Lanka and percentage of single father households in the United States with a correlation coefficient (R) of -0.240 and weighted average of 2.0%, a difference of 12.0%.
Single Father Households Correlation Summary
| Measurement | Laotian | Immigrants from Sri Lanka |
| Minimum | 0.67% | 0.13% |
| Maximum | 9.2% | 3.2% |
| Range | 8.6% | 3.1% |
| Mean | 2.8% | 1.7% |
| Median | 2.2% | 1.7% |
| Interquartile 25% (IQ1) | 2.0% | 1.3% |
| Interquartile 75% (IQ3) | 3.4% | 2.1% |
| Interquartile Range (IQR) | 1.4% | 0.83% |
| Standard Deviation (Sample) | 1.8% | 0.65% |
| Standard Deviation (Population) | 1.8% | 0.64% |
Similar Demographics by Single Father Households
Demographics Similar to Laotians by Single Father Households
In terms of single father households, the demographic groups most similar to Laotians are Luxembourger (2.2%, a difference of 0.040%), Brazilian (2.2%, a difference of 0.090%), British (2.2%, a difference of 0.090%), Immigrants from Nepal (2.2%, a difference of 0.10%), and Slovak (2.2%, a difference of 0.44%).
| Demographics | Rating | Rank | Single Father Households |
| Zimbabweans | 95.1 /100 | #134 | Exceptional 2.2% |
| Syrians | 94.8 /100 | #135 | Exceptional 2.2% |
| Chileans | 94.5 /100 | #136 | Exceptional 2.2% |
| Austrians | 94.2 /100 | #137 | Exceptional 2.2% |
| West Indians | 94.1 /100 | #138 | Exceptional 2.2% |
| Brazilians | 92.8 /100 | #139 | Exceptional 2.2% |
| British | 92.8 /100 | #140 | Exceptional 2.2% |
| Laotians | 92.5 /100 | #141 | Exceptional 2.2% |
| Luxembourgers | 92.3 /100 | #142 | Exceptional 2.2% |
| Immigrants | Nepal | 92.1 /100 | #143 | Exceptional 2.2% |
| Slovaks | 90.7 /100 | #144 | Exceptional 2.2% |
| Immigrants | Zimbabwe | 90.2 /100 | #145 | Exceptional 2.2% |
| Northern Europeans | 89.8 /100 | #146 | Excellent 2.2% |
| Slavs | 88.9 /100 | #147 | Excellent 2.2% |
| South American Indians | 88.5 /100 | #148 | Excellent 2.3% |
Demographics Similar to Immigrants from Sri Lanka by Single Father Households
In terms of single father households, the demographic groups most similar to Immigrants from Sri Lanka are Immigrants from Eastern Europe (2.0%, a difference of 0.0%), Immigrants from Bulgaria (2.0%, a difference of 0.050%), Immigrants from Turkey (2.0%, a difference of 0.23%), Immigrants from St. Vincent and the Grenadines (2.0%, a difference of 0.30%), and Immigrants from Belgium (2.0%, a difference of 0.32%).
| Demographics | Rating | Rank | Single Father Households |
| Chinese | 100.0 /100 | #32 | Exceptional 2.0% |
| Turks | 100.0 /100 | #33 | Exceptional 2.0% |
| Immigrants | Australia | 100.0 /100 | #34 | Exceptional 2.0% |
| Albanians | 100.0 /100 | #35 | Exceptional 2.0% |
| Immigrants | Belgium | 100.0 /100 | #36 | Exceptional 2.0% |
| Immigrants | St. Vincent and the Grenadines | 100.0 /100 | #37 | Exceptional 2.0% |
| Immigrants | Eastern Europe | 100.0 /100 | #38 | Exceptional 2.0% |
| Immigrants | Sri Lanka | 100.0 /100 | #39 | Exceptional 2.0% |
| Immigrants | Bulgaria | 100.0 /100 | #40 | Exceptional 2.0% |
| Immigrants | Turkey | 100.0 /100 | #41 | Exceptional 2.0% |
| Macedonians | 100.0 /100 | #42 | Exceptional 2.0% |
| Immigrants | Grenada | 100.0 /100 | #43 | Exceptional 2.0% |
| Latvians | 100.0 /100 | #44 | Exceptional 2.0% |
| Russians | 100.0 /100 | #45 | Exceptional 2.0% |
| Immigrants | Lebanon | 100.0 /100 | #46 | Exceptional 2.0% |