Seminole vs Immigrants from Armenia Currently Married
COMPARE
Seminole
Immigrants from Armenia
Currently Married
Currently Married Comparison
Seminole
Immigrants from Armenia
44.6%
CURRENTLY MARRIED
0.9/ 100
METRIC RATING
237th/ 347
METRIC RANK
44.3%
CURRENTLY MARRIED
0.4/ 100
METRIC RATING
245th/ 347
METRIC RANK
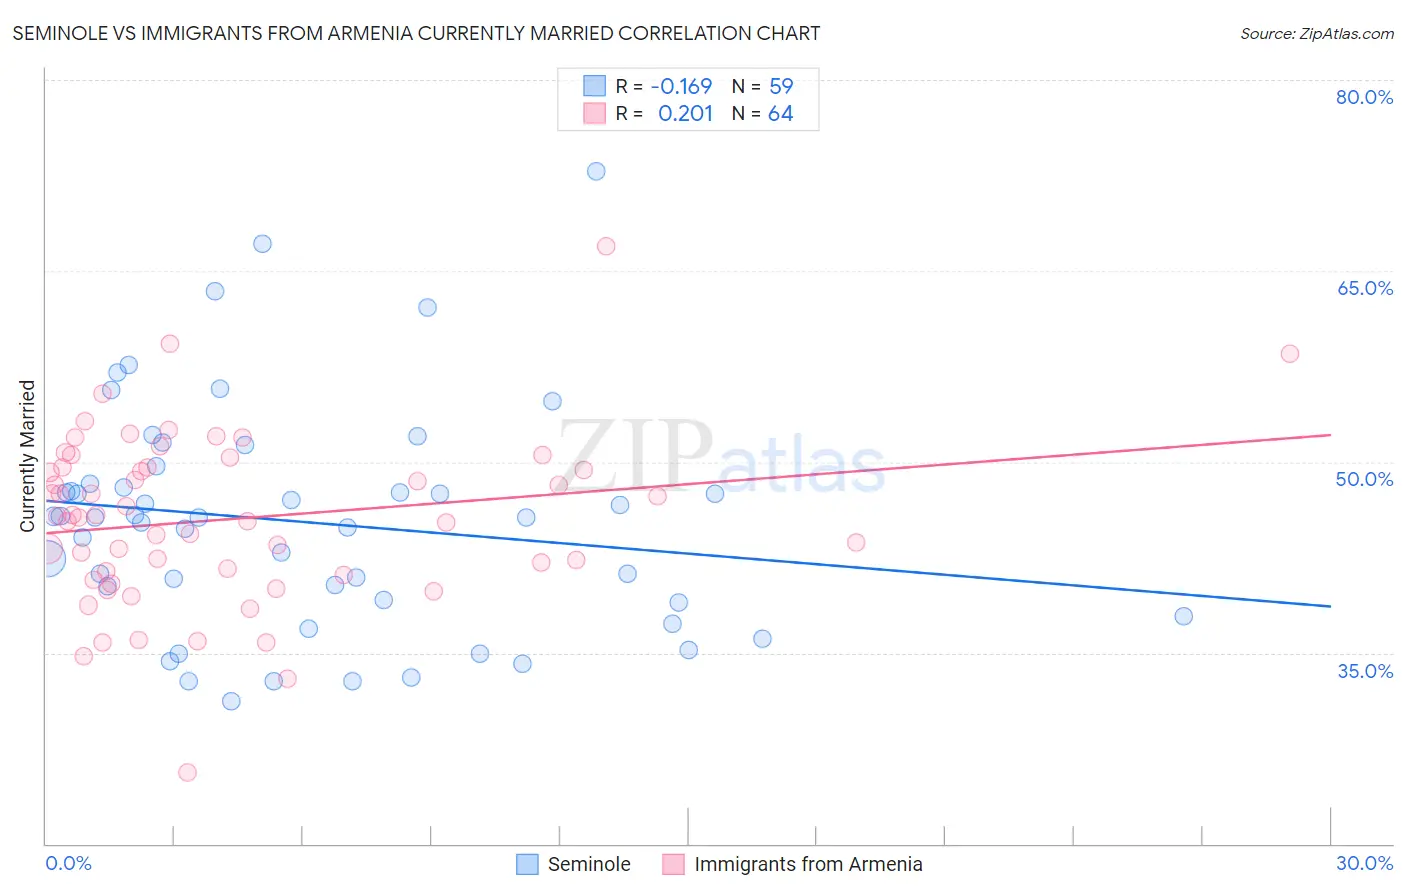
Seminole vs Immigrants from Armenia Currently Married Correlation Chart
The statistical analysis conducted on geographies consisting of 118,313,136 people shows a poor negative correlation between the proportion of Seminole and percentage of population currently married in the United States with a correlation coefficient (R) of -0.169 and weighted average of 44.6%. Similarly, the statistical analysis conducted on geographies consisting of 97,725,276 people shows a weak positive correlation between the proportion of Immigrants from Armenia and percentage of population currently married in the United States with a correlation coefficient (R) of 0.201 and weighted average of 44.3%, a difference of 0.71%.
Currently Married Correlation Summary
| Measurement | Seminole | Immigrants from Armenia |
| Minimum | 31.2% | 25.6% |
| Maximum | 72.8% | 66.9% |
| Range | 41.6% | 41.3% |
| Mean | 45.3% | 45.5% |
| Median | 45.6% | 45.7% |
| Interquartile 25% (IQ1) | 39.0% | 41.2% |
| Interquartile 75% (IQ3) | 48.3% | 49.6% |
| Interquartile Range (IQR) | 9.3% | 8.3% |
| Standard Deviation (Sample) | 8.9% | 6.8% |
| Standard Deviation (Population) | 8.8% | 6.7% |
Demographics Similar to Seminole and Immigrants from Armenia by Currently Married
In terms of currently married, the demographic groups most similar to Seminole are Cuban (44.6%, a difference of 0.0%), Alaskan Athabascan (44.6%, a difference of 0.010%), Moroccan (44.6%, a difference of 0.080%), Iroquois (44.7%, a difference of 0.17%), and Immigrants from Saudi Arabia (44.7%, a difference of 0.18%). Similarly, the demographic groups most similar to Immigrants from Armenia are Immigrants from Burma/Myanmar (44.3%, a difference of 0.070%), Ugandan (44.2%, a difference of 0.20%), Nicaraguan (44.2%, a difference of 0.29%), Immigrants from Cameroon (44.2%, a difference of 0.30%), and Japanese (44.5%, a difference of 0.31%).
| Demographics | Rating | Rank | Currently Married |
| Immigrants | Panama | 1.5 /100 | #231 | Tragic 44.9% |
| Nepalese | 1.2 /100 | #232 | Tragic 44.7% |
| Immigrants | Saudi Arabia | 1.1 /100 | #233 | Tragic 44.7% |
| Iroquois | 1.1 /100 | #234 | Tragic 44.7% |
| Alaskan Athabascans | 0.9 /100 | #235 | Tragic 44.6% |
| Cubans | 0.9 /100 | #236 | Tragic 44.6% |
| Seminole | 0.9 /100 | #237 | Tragic 44.6% |
| Moroccans | 0.9 /100 | #238 | Tragic 44.6% |
| Immigrants | Mexico | 0.7 /100 | #239 | Tragic 44.5% |
| Mexican American Indians | 0.7 /100 | #240 | Tragic 44.5% |
| Ethiopians | 0.7 /100 | #241 | Tragic 44.5% |
| Immigrants | Cambodia | 0.7 /100 | #242 | Tragic 44.5% |
| Immigrants | Ethiopia | 0.7 /100 | #243 | Tragic 44.5% |
| Japanese | 0.6 /100 | #244 | Tragic 44.5% |
| Immigrants | Armenia | 0.4 /100 | #245 | Tragic 44.3% |
| Immigrants | Burma/Myanmar | 0.4 /100 | #246 | Tragic 44.3% |
| Ugandans | 0.4 /100 | #247 | Tragic 44.2% |
| Nicaraguans | 0.3 /100 | #248 | Tragic 44.2% |
| Immigrants | Cameroon | 0.3 /100 | #249 | Tragic 44.2% |
| Immigrants | Eastern Africa | 0.3 /100 | #250 | Tragic 44.2% |
| Blackfeet | 0.3 /100 | #251 | Tragic 44.2% |