Immigrants from Ethiopia vs French Currently Married
COMPARE
Immigrants from Ethiopia
French
Currently Married
Currently Married Comparison
Immigrants from Ethiopia
French
44.5%
CURRENTLY MARRIED
0.7/ 100
METRIC RATING
243rd/ 347
METRIC RANK
48.4%
CURRENTLY MARRIED
98.6/ 100
METRIC RATING
58th/ 347
METRIC RANK
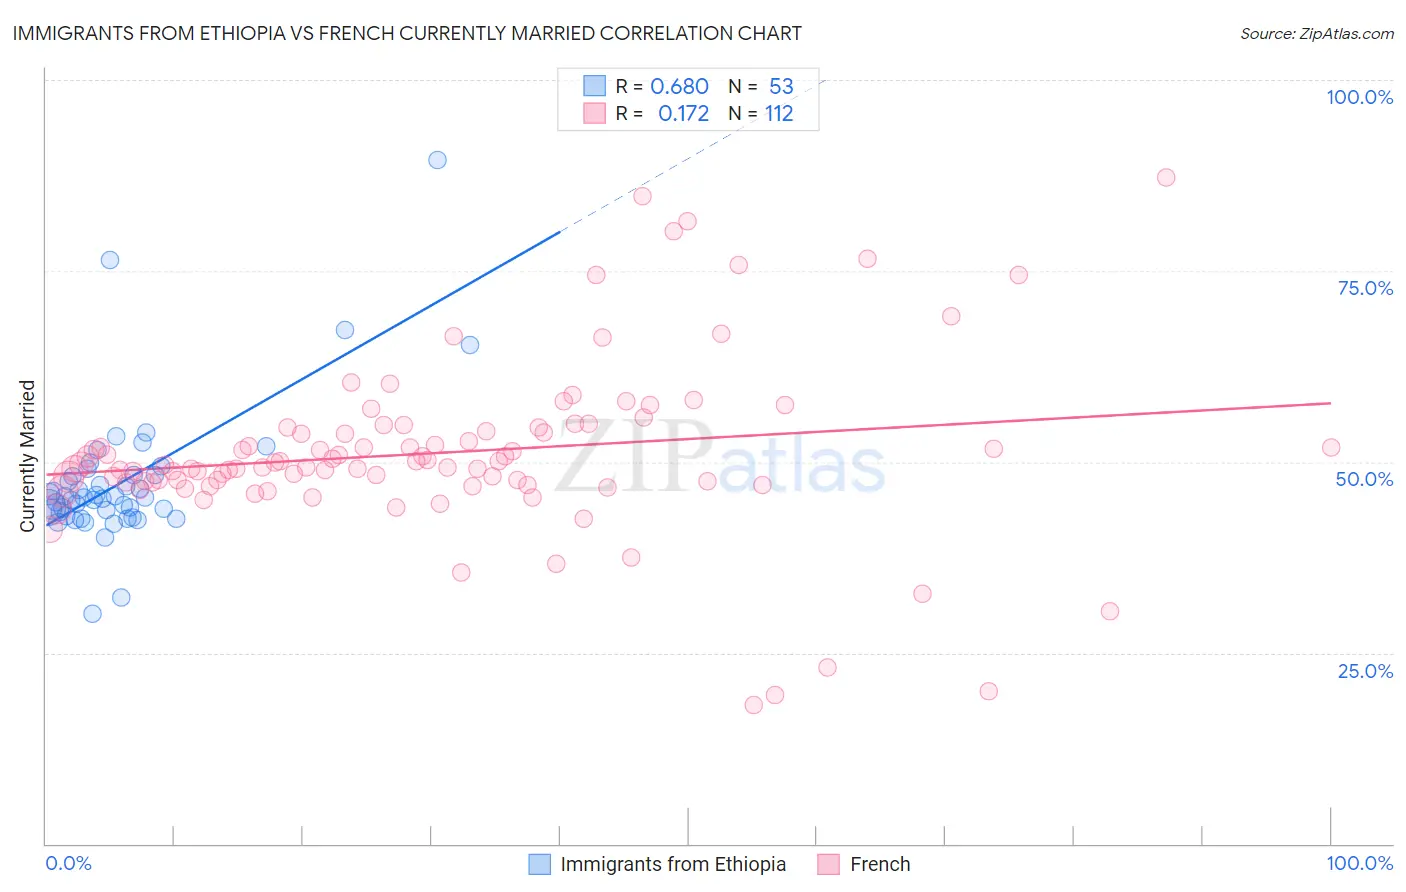
Immigrants from Ethiopia vs French Currently Married Correlation Chart
The statistical analysis conducted on geographies consisting of 211,554,570 people shows a significant positive correlation between the proportion of Immigrants from Ethiopia and percentage of population currently married in the United States with a correlation coefficient (R) of 0.680 and weighted average of 44.5%. Similarly, the statistical analysis conducted on geographies consisting of 572,298,467 people shows a poor positive correlation between the proportion of French and percentage of population currently married in the United States with a correlation coefficient (R) of 0.172 and weighted average of 48.4%, a difference of 8.8%.
Currently Married Correlation Summary
| Measurement | Immigrants from Ethiopia | French |
| Minimum | 30.1% | 18.1% |
| Maximum | 89.5% | 87.2% |
| Range | 59.4% | 69.1% |
| Mean | 47.4% | 51.2% |
| Median | 45.3% | 49.6% |
| Interquartile 25% (IQ1) | 43.2% | 47.3% |
| Interquartile 75% (IQ3) | 48.3% | 54.2% |
| Interquartile Range (IQR) | 5.0% | 6.9% |
| Standard Deviation (Sample) | 9.3% | 11.4% |
| Standard Deviation (Population) | 9.2% | 11.3% |
Similar Demographics by Currently Married
Demographics Similar to Immigrants from Ethiopia by Currently Married
In terms of currently married, the demographic groups most similar to Immigrants from Ethiopia are Immigrants from Cambodia (44.5%, a difference of 0.010%), Ethiopian (44.5%, a difference of 0.040%), Japanese (44.5%, a difference of 0.070%), Immigrants from Mexico (44.5%, a difference of 0.10%), and Mexican American Indian (44.5%, a difference of 0.10%).
| Demographics | Rating | Rank | Currently Married |
| Cubans | 0.9 /100 | #236 | Tragic 44.6% |
| Seminole | 0.9 /100 | #237 | Tragic 44.6% |
| Moroccans | 0.9 /100 | #238 | Tragic 44.6% |
| Immigrants | Mexico | 0.7 /100 | #239 | Tragic 44.5% |
| Mexican American Indians | 0.7 /100 | #240 | Tragic 44.5% |
| Ethiopians | 0.7 /100 | #241 | Tragic 44.5% |
| Immigrants | Cambodia | 0.7 /100 | #242 | Tragic 44.5% |
| Immigrants | Ethiopia | 0.7 /100 | #243 | Tragic 44.5% |
| Japanese | 0.6 /100 | #244 | Tragic 44.5% |
| Immigrants | Armenia | 0.4 /100 | #245 | Tragic 44.3% |
| Immigrants | Burma/Myanmar | 0.4 /100 | #246 | Tragic 44.3% |
| Ugandans | 0.4 /100 | #247 | Tragic 44.2% |
| Nicaraguans | 0.3 /100 | #248 | Tragic 44.2% |
| Immigrants | Cameroon | 0.3 /100 | #249 | Tragic 44.2% |
| Immigrants | Eastern Africa | 0.3 /100 | #250 | Tragic 44.2% |
Demographics Similar to French by Currently Married
In terms of currently married, the demographic groups most similar to French are Immigrants from Ireland (48.4%, a difference of 0.030%), Immigrants from Netherlands (48.5%, a difference of 0.040%), Immigrants from Romania (48.4%, a difference of 0.040%), Romanian (48.4%, a difference of 0.050%), and Asian (48.4%, a difference of 0.060%).
| Demographics | Rating | Rank | Currently Married |
| Whites/Caucasians | 99.0 /100 | #51 | Exceptional 48.6% |
| Russians | 98.9 /100 | #52 | Exceptional 48.6% |
| Immigrants | Austria | 98.8 /100 | #53 | Exceptional 48.5% |
| Immigrants | Moldova | 98.7 /100 | #54 | Exceptional 48.5% |
| Immigrants | North Macedonia | 98.7 /100 | #55 | Exceptional 48.5% |
| Latvians | 98.7 /100 | #56 | Exceptional 48.5% |
| Immigrants | Netherlands | 98.6 /100 | #57 | Exceptional 48.5% |
| French | 98.6 /100 | #58 | Exceptional 48.4% |
| Immigrants | Ireland | 98.5 /100 | #59 | Exceptional 48.4% |
| Immigrants | Romania | 98.5 /100 | #60 | Exceptional 48.4% |
| Romanians | 98.5 /100 | #61 | Exceptional 48.4% |
| Asians | 98.5 /100 | #62 | Exceptional 48.4% |
| Slavs | 98.3 /100 | #63 | Exceptional 48.4% |
| Immigrants | Czechoslovakia | 98.3 /100 | #64 | Exceptional 48.4% |
| Ukrainians | 98.3 /100 | #65 | Exceptional 48.4% |