Korean vs Pakistani Married-couple Households
COMPARE
Korean
Pakistani
Married-couple Households
Married-couple Households Comparison
Koreans
Pakistanis
49.7%
MARRIED-COUPLE HOUSEHOLDS
99.9/ 100
METRIC RATING
15th/ 347
METRIC RANK
47.3%
MARRIED-COUPLE HOUSEHOLDS
88.6/ 100
METRIC RATING
126th/ 347
METRIC RANK
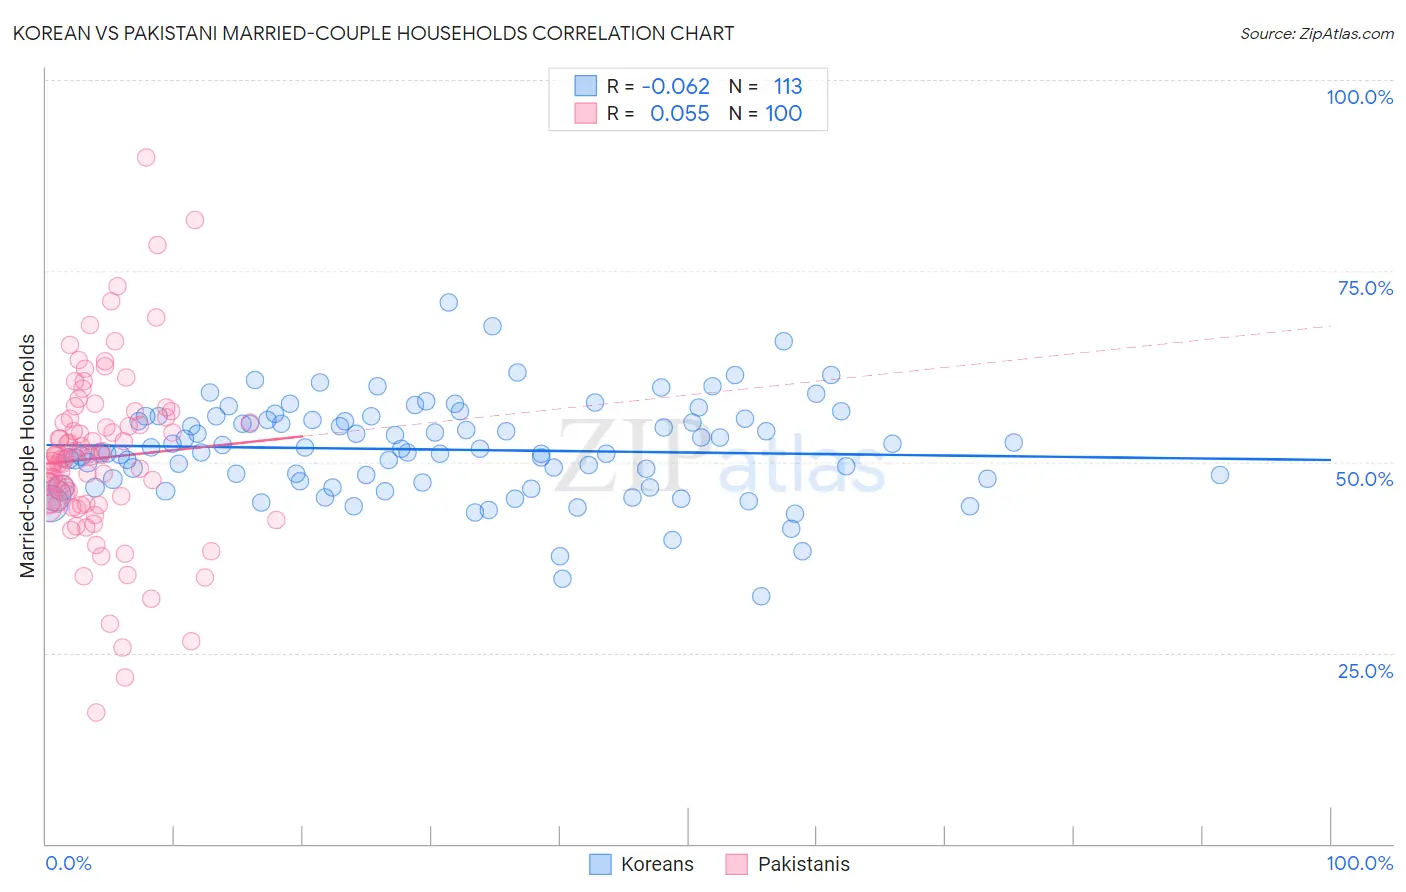
Korean vs Pakistani Married-couple Households Correlation Chart
The statistical analysis conducted on geographies consisting of 510,373,209 people shows a slight negative correlation between the proportion of Koreans and percentage of married-couple family households in the United States with a correlation coefficient (R) of -0.062 and weighted average of 49.7%. Similarly, the statistical analysis conducted on geographies consisting of 335,163,838 people shows a slight positive correlation between the proportion of Pakistanis and percentage of married-couple family households in the United States with a correlation coefficient (R) of 0.055 and weighted average of 47.3%, a difference of 5.1%.
Married-couple Households Correlation Summary
| Measurement | Korean | Pakistani |
| Minimum | 32.4% | 17.3% |
| Maximum | 70.8% | 89.9% |
| Range | 38.4% | 72.7% |
| Mean | 51.6% | 50.5% |
| Median | 51.7% | 50.6% |
| Interquartile 25% (IQ1) | 47.4% | 44.5% |
| Interquartile 75% (IQ3) | 55.6% | 55.5% |
| Interquartile Range (IQR) | 8.2% | 10.9% |
| Standard Deviation (Sample) | 6.3% | 11.5% |
| Standard Deviation (Population) | 6.3% | 11.4% |
Similar Demographics by Married-couple Households
Demographics Similar to Koreans by Married-couple Households
In terms of married-couple households, the demographic groups most similar to Koreans are Swedish (49.7%, a difference of 0.030%), Burmese (49.8%, a difference of 0.14%), Immigrants from Hong Kong (49.6%, a difference of 0.18%), English (49.6%, a difference of 0.19%), and Immigrants from Korea (49.9%, a difference of 0.27%).
| Demographics | Rating | Rank | Married-couple Households |
| Immigrants | South Central Asia | 100.0 /100 | #8 | Exceptional 50.6% |
| Pennsylvania Germans | 100.0 /100 | #9 | Exceptional 50.4% |
| Chinese | 100.0 /100 | #10 | Exceptional 50.4% |
| Immigrants | Pakistan | 100.0 /100 | #11 | Exceptional 50.1% |
| Swiss | 100.0 /100 | #12 | Exceptional 49.9% |
| Immigrants | Korea | 100.0 /100 | #13 | Exceptional 49.9% |
| Burmese | 100.0 /100 | #14 | Exceptional 49.8% |
| Koreans | 99.9 /100 | #15 | Exceptional 49.7% |
| Swedes | 99.9 /100 | #16 | Exceptional 49.7% |
| Immigrants | Hong Kong | 99.9 /100 | #17 | Exceptional 49.6% |
| English | 99.9 /100 | #18 | Exceptional 49.6% |
| Europeans | 99.9 /100 | #19 | Exceptional 49.6% |
| Scandinavians | 99.9 /100 | #20 | Exceptional 49.6% |
| Norwegians | 99.9 /100 | #21 | Exceptional 49.5% |
| Asians | 99.9 /100 | #22 | Exceptional 49.5% |
Demographics Similar to Pakistanis by Married-couple Households
In terms of married-couple households, the demographic groups most similar to Pakistanis are Australian (47.4%, a difference of 0.030%), Celtic (47.3%, a difference of 0.040%), Zimbabwean (47.4%, a difference of 0.050%), Immigrants from Venezuela (47.4%, a difference of 0.060%), and Immigrants from Peru (47.3%, a difference of 0.070%).
| Demographics | Rating | Rank | Married-couple Households |
| Chileans | 92.2 /100 | #119 | Exceptional 47.5% |
| Puget Sound Salish | 90.5 /100 | #120 | Exceptional 47.4% |
| Immigrants | Eastern Europe | 90.3 /100 | #121 | Exceptional 47.4% |
| Okinawans | 90.1 /100 | #122 | Exceptional 47.4% |
| Immigrants | Venezuela | 89.3 /100 | #123 | Excellent 47.4% |
| Zimbabweans | 89.2 /100 | #124 | Excellent 47.4% |
| Australians | 89.0 /100 | #125 | Excellent 47.4% |
| Pakistanis | 88.6 /100 | #126 | Excellent 47.3% |
| Celtics | 88.1 /100 | #127 | Excellent 47.3% |
| Immigrants | Peru | 87.9 /100 | #128 | Excellent 47.3% |
| Immigrants | Iraq | 87.8 /100 | #129 | Excellent 47.3% |
| Immigrants | Hungary | 87.8 /100 | #130 | Excellent 47.3% |
| Immigrants | Denmark | 87.5 /100 | #131 | Excellent 47.3% |
| Immigrants | Ukraine | 86.7 /100 | #132 | Excellent 47.3% |
| South Africans | 86.4 /100 | #133 | Excellent 47.3% |