Chinese vs Immigrants from Bahamas Currently Married
COMPARE
Chinese
Immigrants from Bahamas
Currently Married
Currently Married Comparison
Chinese
Immigrants from Bahamas
49.5%
CURRENTLY MARRIED
99.9/ 100
METRIC RATING
16th/ 347
METRIC RANK
41.9%
CURRENTLY MARRIED
0.0/ 100
METRIC RATING
304th/ 347
METRIC RANK
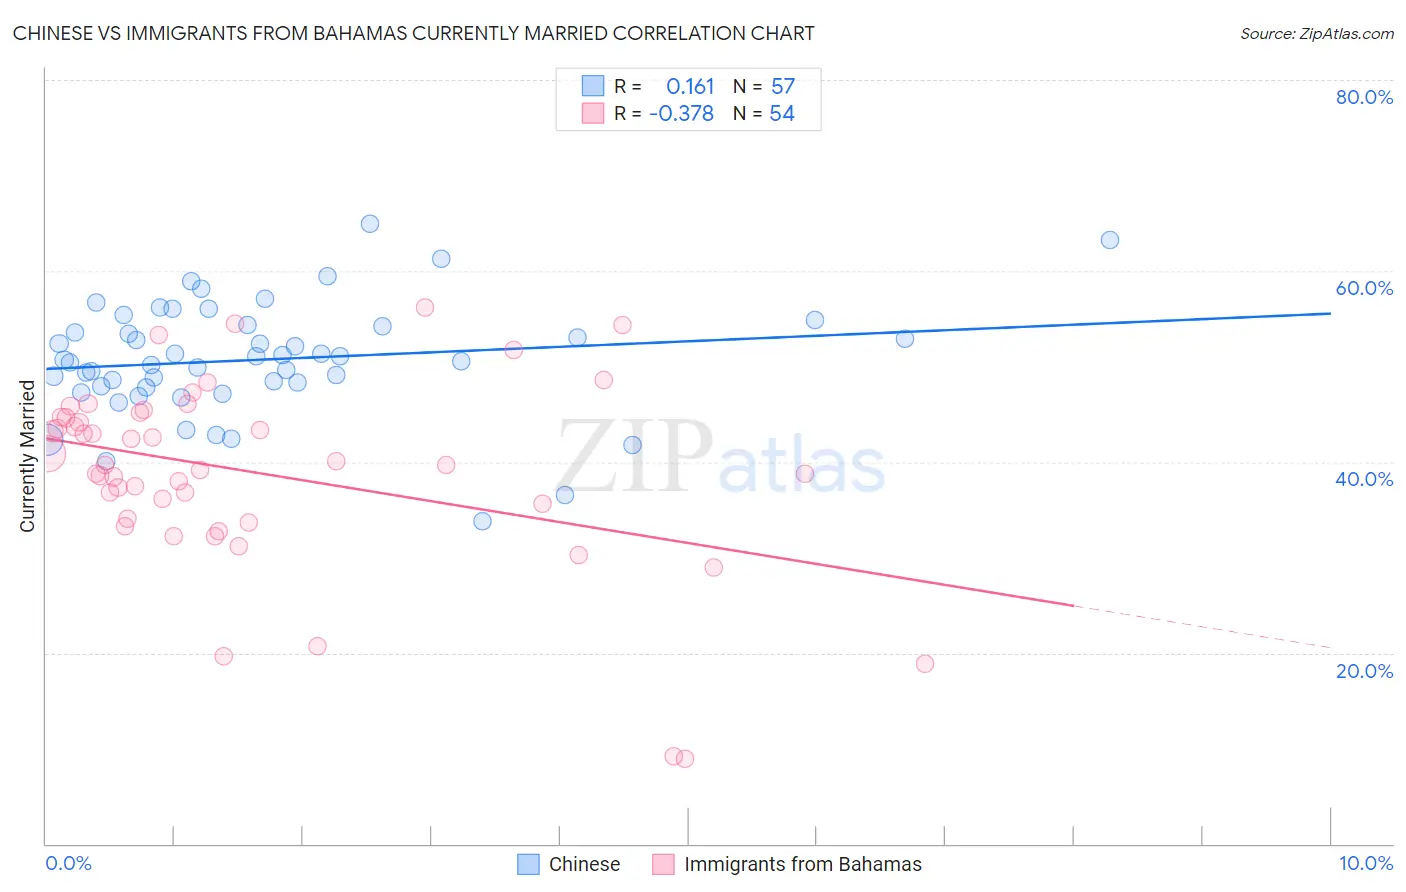
Chinese vs Immigrants from Bahamas Currently Married Correlation Chart
The statistical analysis conducted on geographies consisting of 64,808,439 people shows a poor positive correlation between the proportion of Chinese and percentage of population currently married in the United States with a correlation coefficient (R) of 0.161 and weighted average of 49.5%. Similarly, the statistical analysis conducted on geographies consisting of 104,648,272 people shows a mild negative correlation between the proportion of Immigrants from Bahamas and percentage of population currently married in the United States with a correlation coefficient (R) of -0.378 and weighted average of 41.9%, a difference of 18.1%.
Currently Married Correlation Summary
| Measurement | Chinese | Immigrants from Bahamas |
| Minimum | 33.8% | 8.9% |
| Maximum | 64.9% | 56.2% |
| Range | 31.1% | 47.3% |
| Mean | 50.7% | 38.9% |
| Median | 50.7% | 39.7% |
| Interquartile 25% (IQ1) | 47.9% | 34.0% |
| Interquartile 75% (IQ3) | 54.3% | 44.7% |
| Interquartile Range (IQR) | 6.4% | 10.6% |
| Standard Deviation (Sample) | 6.0% | 9.9% |
| Standard Deviation (Population) | 5.9% | 9.8% |
Similar Demographics by Currently Married
Demographics Similar to Chinese by Currently Married
In terms of currently married, the demographic groups most similar to Chinese are Scandinavian (49.5%, a difference of 0.020%), Pennsylvania German (49.6%, a difference of 0.14%), German (49.6%, a difference of 0.17%), Dutch (49.6%, a difference of 0.18%), and Immigrants from Scotland (49.3%, a difference of 0.31%).
| Demographics | Rating | Rank | Currently Married |
| Czechs | 99.9 /100 | #9 | Exceptional 49.9% |
| Filipinos | 99.9 /100 | #10 | Exceptional 49.7% |
| English | 99.9 /100 | #11 | Exceptional 49.7% |
| Swiss | 99.9 /100 | #12 | Exceptional 49.7% |
| Dutch | 99.9 /100 | #13 | Exceptional 49.6% |
| Germans | 99.9 /100 | #14 | Exceptional 49.6% |
| Pennsylvania Germans | 99.9 /100 | #15 | Exceptional 49.6% |
| Chinese | 99.9 /100 | #16 | Exceptional 49.5% |
| Scandinavians | 99.9 /100 | #17 | Exceptional 49.5% |
| Immigrants | Scotland | 99.8 /100 | #18 | Exceptional 49.3% |
| Europeans | 99.8 /100 | #19 | Exceptional 49.3% |
| Luxembourgers | 99.8 /100 | #20 | Exceptional 49.3% |
| Scottish | 99.8 /100 | #21 | Exceptional 49.2% |
| Bulgarians | 99.7 /100 | #22 | Exceptional 49.1% |
| Immigrants | Pakistan | 99.7 /100 | #23 | Exceptional 49.1% |
Demographics Similar to Immigrants from Bahamas by Currently Married
In terms of currently married, the demographic groups most similar to Immigrants from Bahamas are Immigrants from Trinidad and Tobago (41.9%, a difference of 0.030%), Immigrants from Guyana (41.9%, a difference of 0.040%), Sioux (41.9%, a difference of 0.11%), Immigrants from Zaire (42.0%, a difference of 0.13%), and African (41.8%, a difference of 0.18%).
| Demographics | Rating | Rank | Currently Married |
| Cheyenne | 0.0 /100 | #297 | Tragic 42.2% |
| Immigrants | Honduras | 0.0 /100 | #298 | Tragic 42.2% |
| Liberians | 0.0 /100 | #299 | Tragic 42.2% |
| Belizeans | 0.0 /100 | #300 | Tragic 42.2% |
| Immigrants | Yemen | 0.0 /100 | #301 | Tragic 42.1% |
| Immigrants | Zaire | 0.0 /100 | #302 | Tragic 42.0% |
| Sioux | 0.0 /100 | #303 | Tragic 41.9% |
| Immigrants | Bahamas | 0.0 /100 | #304 | Tragic 41.9% |
| Immigrants | Trinidad and Tobago | 0.0 /100 | #305 | Tragic 41.9% |
| Immigrants | Guyana | 0.0 /100 | #306 | Tragic 41.9% |
| Africans | 0.0 /100 | #307 | Tragic 41.8% |
| Immigrants | Belize | 0.0 /100 | #308 | Tragic 41.8% |
| Immigrants | Liberia | 0.0 /100 | #309 | Tragic 41.8% |
| Guyanese | 0.0 /100 | #310 | Tragic 41.6% |
| Trinidadians and Tobagonians | 0.0 /100 | #311 | Tragic 41.5% |