Immigrants from Indonesia vs Immigrants from Bahamas Currently Married
COMPARE
Immigrants from Indonesia
Immigrants from Bahamas
Currently Married
Currently Married Comparison
Immigrants from Indonesia
Immigrants from Bahamas
47.6%
CURRENTLY MARRIED
90.5/ 100
METRIC RATING
115th/ 347
METRIC RANK
41.9%
CURRENTLY MARRIED
0.0/ 100
METRIC RATING
304th/ 347
METRIC RANK
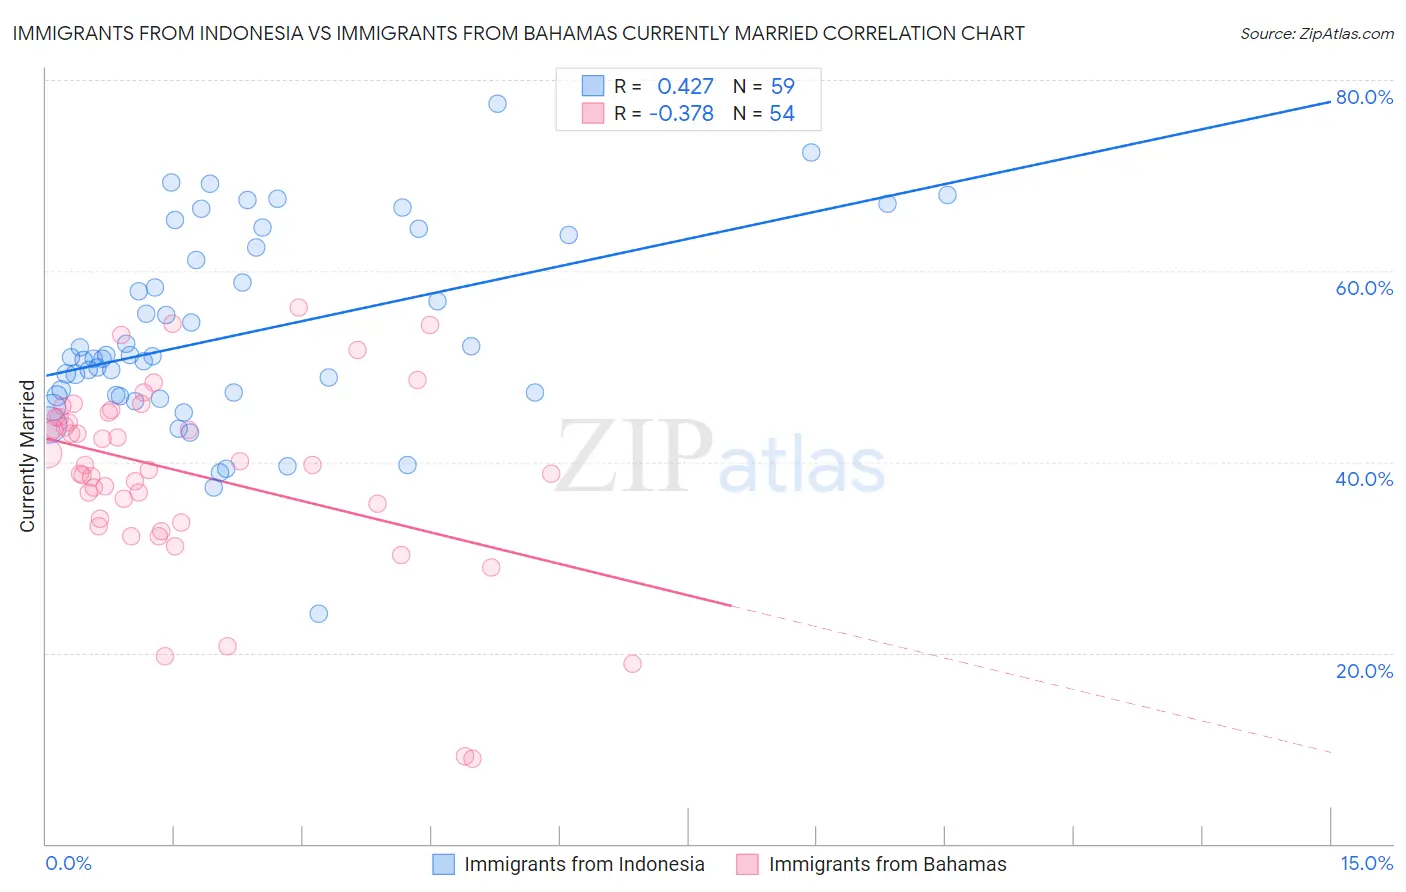
Immigrants from Indonesia vs Immigrants from Bahamas Currently Married Correlation Chart
The statistical analysis conducted on geographies consisting of 215,768,024 people shows a moderate positive correlation between the proportion of Immigrants from Indonesia and percentage of population currently married in the United States with a correlation coefficient (R) of 0.427 and weighted average of 47.6%. Similarly, the statistical analysis conducted on geographies consisting of 104,648,272 people shows a mild negative correlation between the proportion of Immigrants from Bahamas and percentage of population currently married in the United States with a correlation coefficient (R) of -0.378 and weighted average of 41.9%, a difference of 13.6%.
Currently Married Correlation Summary
| Measurement | Immigrants from Indonesia | Immigrants from Bahamas |
| Minimum | 24.1% | 8.9% |
| Maximum | 77.5% | 56.2% |
| Range | 53.4% | 47.3% |
| Mean | 53.3% | 38.9% |
| Median | 51.0% | 39.7% |
| Interquartile 25% (IQ1) | 46.9% | 34.0% |
| Interquartile 75% (IQ3) | 62.4% | 44.7% |
| Interquartile Range (IQR) | 15.5% | 10.6% |
| Standard Deviation (Sample) | 10.3% | 9.9% |
| Standard Deviation (Population) | 10.2% | 9.8% |
Similar Demographics by Currently Married
Demographics Similar to Immigrants from Indonesia by Currently Married
In terms of currently married, the demographic groups most similar to Immigrants from Indonesia are South African (47.6%, a difference of 0.0%), Palestinian (47.6%, a difference of 0.010%), Puget Sound Salish (47.6%, a difference of 0.020%), Immigrants from Philippines (47.6%, a difference of 0.030%), and Australian (47.6%, a difference of 0.030%).
| Demographics | Rating | Rank | Currently Married |
| Tsimshian | 92.4 /100 | #108 | Exceptional 47.7% |
| Immigrants | Egypt | 92.3 /100 | #109 | Exceptional 47.7% |
| Immigrants | Russia | 92.0 /100 | #110 | Exceptional 47.7% |
| Immigrants | Hungary | 91.2 /100 | #111 | Exceptional 47.6% |
| Immigrants | Western Europe | 91.1 /100 | #112 | Exceptional 47.6% |
| Immigrants | Denmark | 90.9 /100 | #113 | Exceptional 47.6% |
| South Africans | 90.5 /100 | #114 | Exceptional 47.6% |
| Immigrants | Indonesia | 90.5 /100 | #115 | Exceptional 47.6% |
| Palestinians | 90.4 /100 | #116 | Exceptional 47.6% |
| Puget Sound Salish | 90.3 /100 | #117 | Exceptional 47.6% |
| Immigrants | Philippines | 90.2 /100 | #118 | Exceptional 47.6% |
| Australians | 90.2 /100 | #119 | Exceptional 47.6% |
| Syrians | 88.9 /100 | #120 | Excellent 47.5% |
| Immigrants | Croatia | 88.6 /100 | #121 | Excellent 47.5% |
| Osage | 87.9 /100 | #122 | Excellent 47.5% |
Demographics Similar to Immigrants from Bahamas by Currently Married
In terms of currently married, the demographic groups most similar to Immigrants from Bahamas are Immigrants from Trinidad and Tobago (41.9%, a difference of 0.030%), Immigrants from Guyana (41.9%, a difference of 0.040%), Sioux (41.9%, a difference of 0.11%), Immigrants from Zaire (42.0%, a difference of 0.13%), and African (41.8%, a difference of 0.18%).
| Demographics | Rating | Rank | Currently Married |
| Cheyenne | 0.0 /100 | #297 | Tragic 42.2% |
| Immigrants | Honduras | 0.0 /100 | #298 | Tragic 42.2% |
| Liberians | 0.0 /100 | #299 | Tragic 42.2% |
| Belizeans | 0.0 /100 | #300 | Tragic 42.2% |
| Immigrants | Yemen | 0.0 /100 | #301 | Tragic 42.1% |
| Immigrants | Zaire | 0.0 /100 | #302 | Tragic 42.0% |
| Sioux | 0.0 /100 | #303 | Tragic 41.9% |
| Immigrants | Bahamas | 0.0 /100 | #304 | Tragic 41.9% |
| Immigrants | Trinidad and Tobago | 0.0 /100 | #305 | Tragic 41.9% |
| Immigrants | Guyana | 0.0 /100 | #306 | Tragic 41.9% |
| Africans | 0.0 /100 | #307 | Tragic 41.8% |
| Immigrants | Belize | 0.0 /100 | #308 | Tragic 41.8% |
| Immigrants | Liberia | 0.0 /100 | #309 | Tragic 41.8% |
| Guyanese | 0.0 /100 | #310 | Tragic 41.6% |
| Trinidadians and Tobagonians | 0.0 /100 | #311 | Tragic 41.5% |