Kenyan vs Immigrants from Kazakhstan Currently Married
COMPARE
Kenyan
Immigrants from Kazakhstan
Currently Married
Currently Married Comparison
Kenyans
Immigrants from Kazakhstan
45.2%
CURRENTLY MARRIED
3.1/ 100
METRIC RATING
220th/ 347
METRIC RANK
47.4%
CURRENTLY MARRIED
87.2/ 100
METRIC RATING
123rd/ 347
METRIC RANK
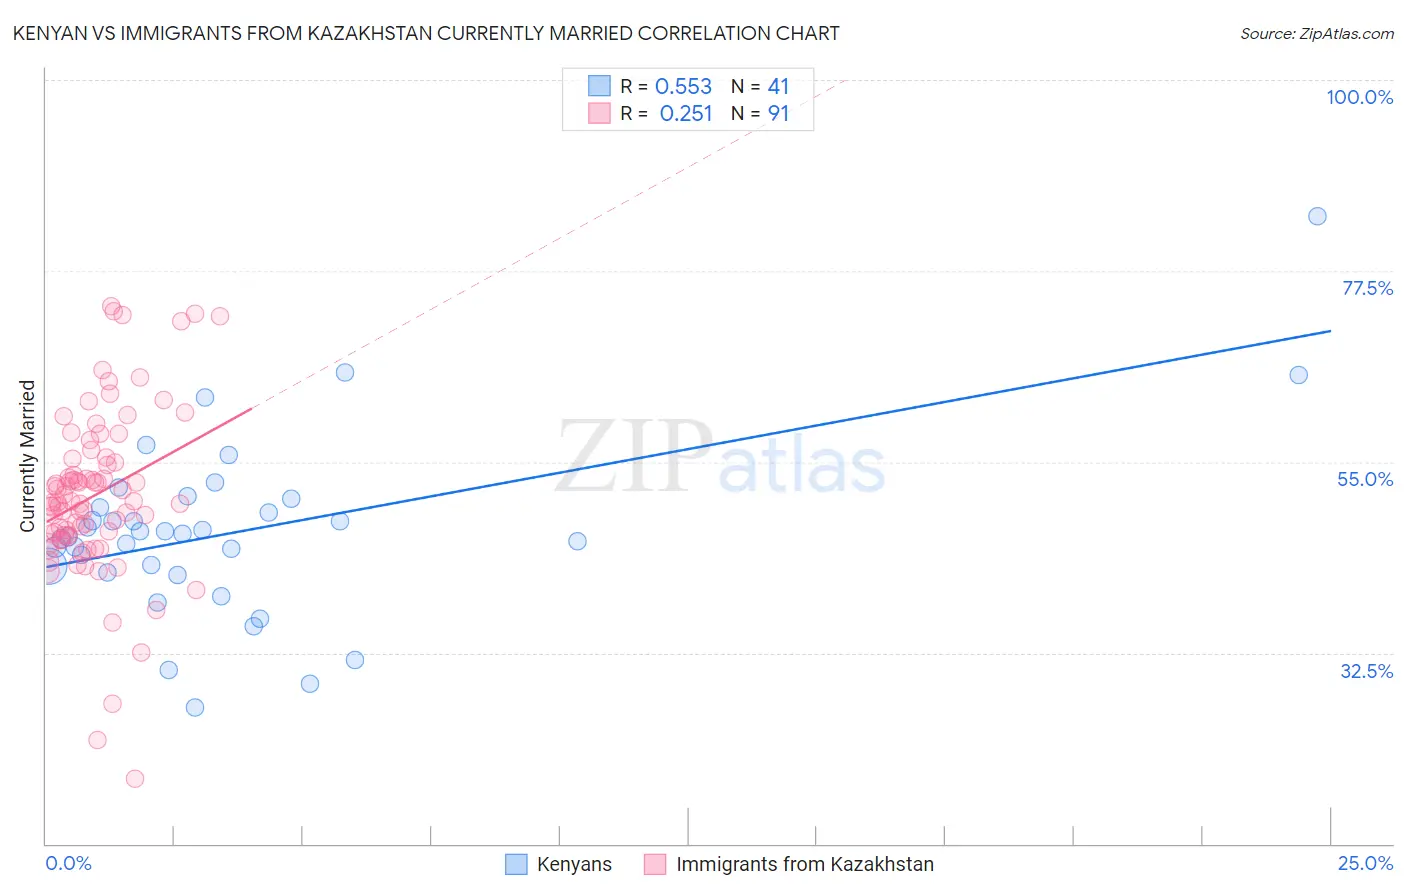
Kenyan vs Immigrants from Kazakhstan Currently Married Correlation Chart
The statistical analysis conducted on geographies consisting of 168,238,911 people shows a substantial positive correlation between the proportion of Kenyans and percentage of population currently married in the United States with a correlation coefficient (R) of 0.553 and weighted average of 45.2%. Similarly, the statistical analysis conducted on geographies consisting of 124,441,390 people shows a weak positive correlation between the proportion of Immigrants from Kazakhstan and percentage of population currently married in the United States with a correlation coefficient (R) of 0.251 and weighted average of 47.4%, a difference of 5.1%.
Currently Married Correlation Summary
| Measurement | Kenyan | Immigrants from Kazakhstan |
| Minimum | 26.0% | 17.6% |
| Maximum | 83.9% | 73.4% |
| Range | 57.9% | 55.8% |
| Mean | 46.8% | 51.1% |
| Median | 46.5% | 50.3% |
| Interquartile 25% (IQ1) | 42.3% | 46.3% |
| Interquartile 75% (IQ3) | 50.1% | 55.4% |
| Interquartile Range (IQR) | 7.8% | 9.1% |
| Standard Deviation (Sample) | 10.4% | 9.9% |
| Standard Deviation (Population) | 10.3% | 9.8% |
Similar Demographics by Currently Married
Demographics Similar to Kenyans by Currently Married
In terms of currently married, the demographic groups most similar to Kenyans are Mexican (45.2%, a difference of 0.020%), Immigrants from Portugal (45.2%, a difference of 0.13%), Immigrants from the Azores (45.1%, a difference of 0.22%), Panamanian (45.3%, a difference of 0.24%), and Immigrants from Laos (45.0%, a difference of 0.30%).
| Demographics | Rating | Rank | Currently Married |
| Alaska Natives | 7.0 /100 | #213 | Tragic 45.5% |
| Dutch West Indians | 6.7 /100 | #214 | Tragic 45.5% |
| German Russians | 6.7 /100 | #215 | Tragic 45.5% |
| Immigrants | Morocco | 5.5 /100 | #216 | Tragic 45.4% |
| Immigrants | Thailand | 5.1 /100 | #217 | Tragic 45.4% |
| Panamanians | 4.0 /100 | #218 | Tragic 45.3% |
| Immigrants | Portugal | 3.5 /100 | #219 | Tragic 45.2% |
| Kenyans | 3.1 /100 | #220 | Tragic 45.2% |
| Mexicans | 3.0 /100 | #221 | Tragic 45.2% |
| Immigrants | Azores | 2.5 /100 | #222 | Tragic 45.1% |
| Immigrants | Laos | 2.3 /100 | #223 | Tragic 45.0% |
| Immigrants | Uganda | 2.2 /100 | #224 | Tragic 45.0% |
| French American Indians | 2.2 /100 | #225 | Tragic 45.0% |
| Comanche | 2.1 /100 | #226 | Tragic 45.0% |
| Spanish Americans | 2.1 /100 | #227 | Tragic 45.0% |
Demographics Similar to Immigrants from Kazakhstan by Currently Married
In terms of currently married, the demographic groups most similar to Immigrants from Kazakhstan are Laotian (47.4%, a difference of 0.050%), Osage (47.5%, a difference of 0.060%), Immigrants from Croatia (47.5%, a difference of 0.12%), Syrian (47.5%, a difference of 0.15%), and Okinawan (47.4%, a difference of 0.15%).
| Demographics | Rating | Rank | Currently Married |
| Palestinians | 90.4 /100 | #116 | Exceptional 47.6% |
| Puget Sound Salish | 90.3 /100 | #117 | Exceptional 47.6% |
| Immigrants | Philippines | 90.2 /100 | #118 | Exceptional 47.6% |
| Australians | 90.2 /100 | #119 | Exceptional 47.6% |
| Syrians | 88.9 /100 | #120 | Excellent 47.5% |
| Immigrants | Croatia | 88.6 /100 | #121 | Excellent 47.5% |
| Osage | 87.9 /100 | #122 | Excellent 47.5% |
| Immigrants | Kazakhstan | 87.2 /100 | #123 | Excellent 47.4% |
| Laotians | 86.6 /100 | #124 | Excellent 47.4% |
| Okinawans | 85.3 /100 | #125 | Excellent 47.4% |
| Immigrants | Jordan | 84.9 /100 | #126 | Excellent 47.4% |
| New Zealanders | 84.9 /100 | #127 | Excellent 47.4% |
| Portuguese | 84.2 /100 | #128 | Excellent 47.3% |
| Sri Lankans | 83.2 /100 | #129 | Excellent 47.3% |
| Immigrants | Iraq | 82.8 /100 | #130 | Excellent 47.3% |