Kenyan vs Slavic Child Poverty Under the Age of 16
COMPARE
Kenyan
Slavic
Child Poverty Under the Age of 16
Child Poverty Under the Age of 16 Comparison
Kenyans
Slavs
16.5%
CHILD POVERTY UNDER THE AGE OF 16
34.1/ 100
METRIC RATING
186th/ 347
METRIC RANK
15.4%
CHILD POVERTY UNDER THE AGE OF 16
84.2/ 100
METRIC RATING
141st/ 347
METRIC RANK
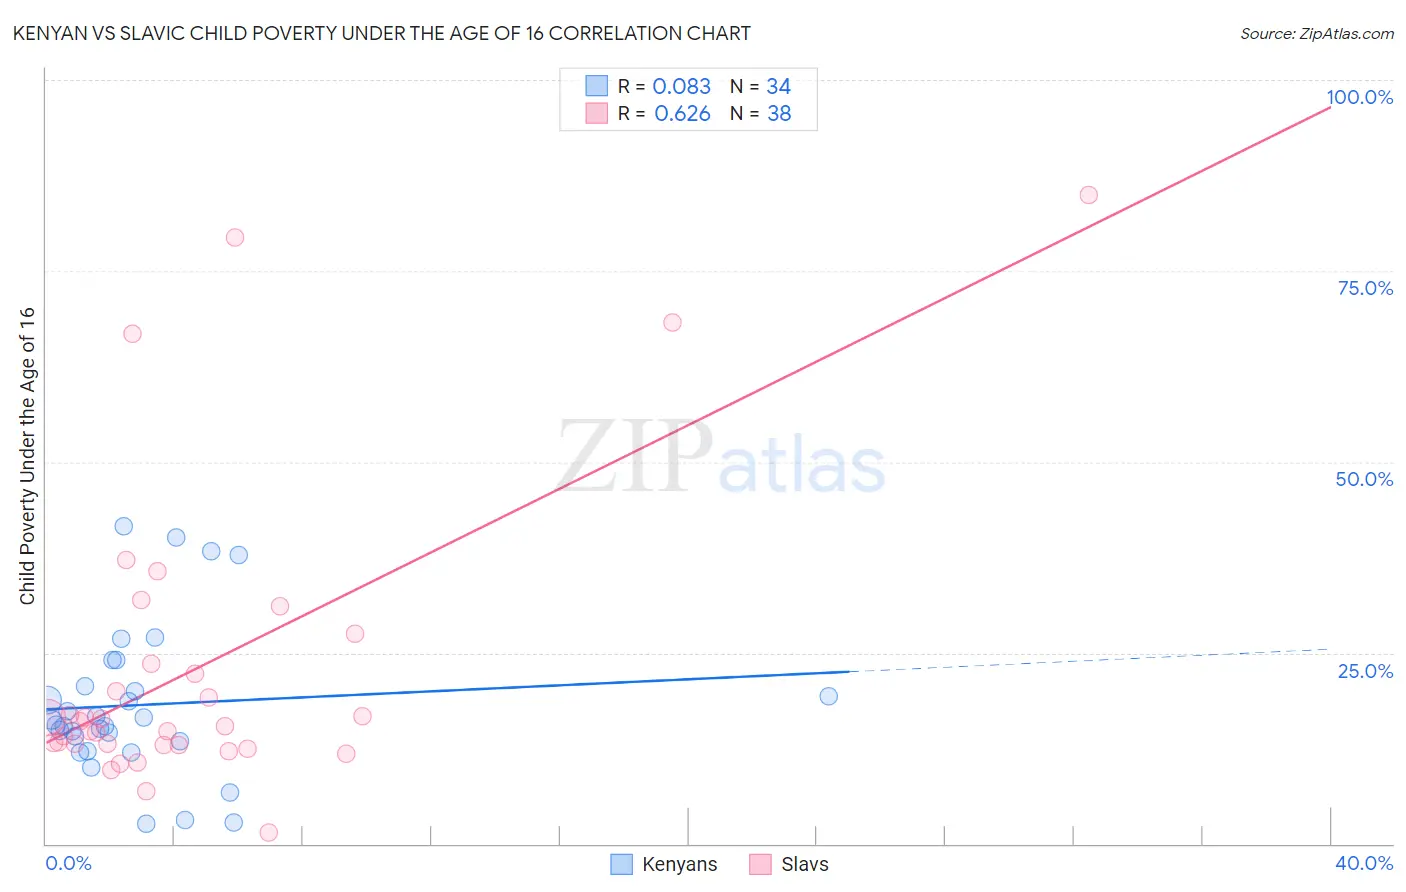
Kenyan vs Slavic Child Poverty Under the Age of 16 Correlation Chart
The statistical analysis conducted on geographies consisting of 167,780,048 people shows a slight positive correlation between the proportion of Kenyans and poverty level among children under the age of 16 in the United States with a correlation coefficient (R) of 0.083 and weighted average of 16.5%. Similarly, the statistical analysis conducted on geographies consisting of 268,968,300 people shows a significant positive correlation between the proportion of Slavs and poverty level among children under the age of 16 in the United States with a correlation coefficient (R) of 0.626 and weighted average of 15.4%, a difference of 7.4%.
Child Poverty Under the Age of 16 Correlation Summary
| Measurement | Kenyan | Slavic |
| Minimum | 2.6% | 1.5% |
| Maximum | 41.6% | 85.0% |
| Range | 38.9% | 83.5% |
| Mean | 18.2% | 23.0% |
| Median | 15.9% | 15.7% |
| Interquartile 25% (IQ1) | 13.4% | 13.0% |
| Interquartile 75% (IQ3) | 20.6% | 23.5% |
| Interquartile Range (IQR) | 7.2% | 10.6% |
| Standard Deviation (Sample) | 9.8% | 19.7% |
| Standard Deviation (Population) | 9.7% | 19.4% |
Similar Demographics by Child Poverty Under the Age of 16
Demographics Similar to Kenyans by Child Poverty Under the Age of 16
In terms of child poverty under the age of 16, the demographic groups most similar to Kenyans are Arab (16.6%, a difference of 0.36%), Immigrants from Morocco (16.6%, a difference of 0.38%), Immigrants from Bosnia and Herzegovina (16.5%, a difference of 0.43%), Immigrants from Western Asia (16.4%, a difference of 0.50%), and Celtic (16.4%, a difference of 0.52%).
| Demographics | Rating | Rank | Child Poverty Under the Age of 16 |
| Immigrants | Syria | 42.3 /100 | #179 | Average 16.4% |
| South American Indians | 41.8 /100 | #180 | Average 16.4% |
| Immigrants | South America | 40.8 /100 | #181 | Average 16.4% |
| Hawaiians | 38.2 /100 | #182 | Fair 16.4% |
| Celtics | 38.2 /100 | #183 | Fair 16.4% |
| Immigrants | Western Asia | 38.0 /100 | #184 | Fair 16.4% |
| Immigrants | Bosnia and Herzegovina | 37.4 /100 | #185 | Fair 16.5% |
| Kenyans | 34.1 /100 | #186 | Fair 16.5% |
| Arabs | 31.4 /100 | #187 | Fair 16.6% |
| Immigrants | Morocco | 31.2 /100 | #188 | Fair 16.6% |
| Immigrants | Portugal | 30.0 /100 | #189 | Fair 16.6% |
| Immigrants | Costa Rica | 29.6 /100 | #190 | Fair 16.6% |
| Immigrants | Iraq | 28.3 /100 | #191 | Fair 16.7% |
| Spanish | 24.5 /100 | #192 | Fair 16.7% |
| Spaniards | 23.2 /100 | #193 | Fair 16.8% |
Demographics Similar to Slavs by Child Poverty Under the Age of 16
In terms of child poverty under the age of 16, the demographic groups most similar to Slavs are Brazilian (15.4%, a difference of 0.34%), Icelander (15.4%, a difference of 0.41%), Immigrants from Hungary (15.5%, a difference of 0.53%), Immigrants from Peru (15.5%, a difference of 0.58%), and Slovak (15.5%, a difference of 0.62%).
| Demographics | Rating | Rank | Child Poverty Under the Age of 16 |
| Native Hawaiians | 88.7 /100 | #134 | Excellent 15.2% |
| Albanians | 88.6 /100 | #135 | Excellent 15.2% |
| Immigrants | Spain | 87.3 /100 | #136 | Excellent 15.3% |
| Peruvians | 87.2 /100 | #137 | Excellent 15.3% |
| Welsh | 87.2 /100 | #138 | Excellent 15.3% |
| Immigrants | Vietnam | 87.1 /100 | #139 | Excellent 15.3% |
| New Zealanders | 86.9 /100 | #140 | Excellent 15.3% |
| Slavs | 84.2 /100 | #141 | Excellent 15.4% |
| Brazilians | 82.8 /100 | #142 | Excellent 15.4% |
| Icelanders | 82.5 /100 | #143 | Excellent 15.4% |
| Immigrants | Hungary | 81.9 /100 | #144 | Excellent 15.5% |
| Immigrants | Peru | 81.7 /100 | #145 | Excellent 15.5% |
| Slovaks | 81.4 /100 | #146 | Excellent 15.5% |
| Immigrants | Kuwait | 80.5 /100 | #147 | Excellent 15.5% |
| Puget Sound Salish | 80.3 /100 | #148 | Excellent 15.5% |