Kenyan vs Slavic Median Earnings
COMPARE
Kenyan
Slavic
Median Earnings
Median Earnings Comparison
Kenyans
Slavs
$46,462
MEDIAN EARNINGS
51.0/ 100
METRIC RATING
172nd/ 347
METRIC RANK
$47,470
MEDIAN EARNINGS
81.1/ 100
METRIC RATING
153rd/ 347
METRIC RANK
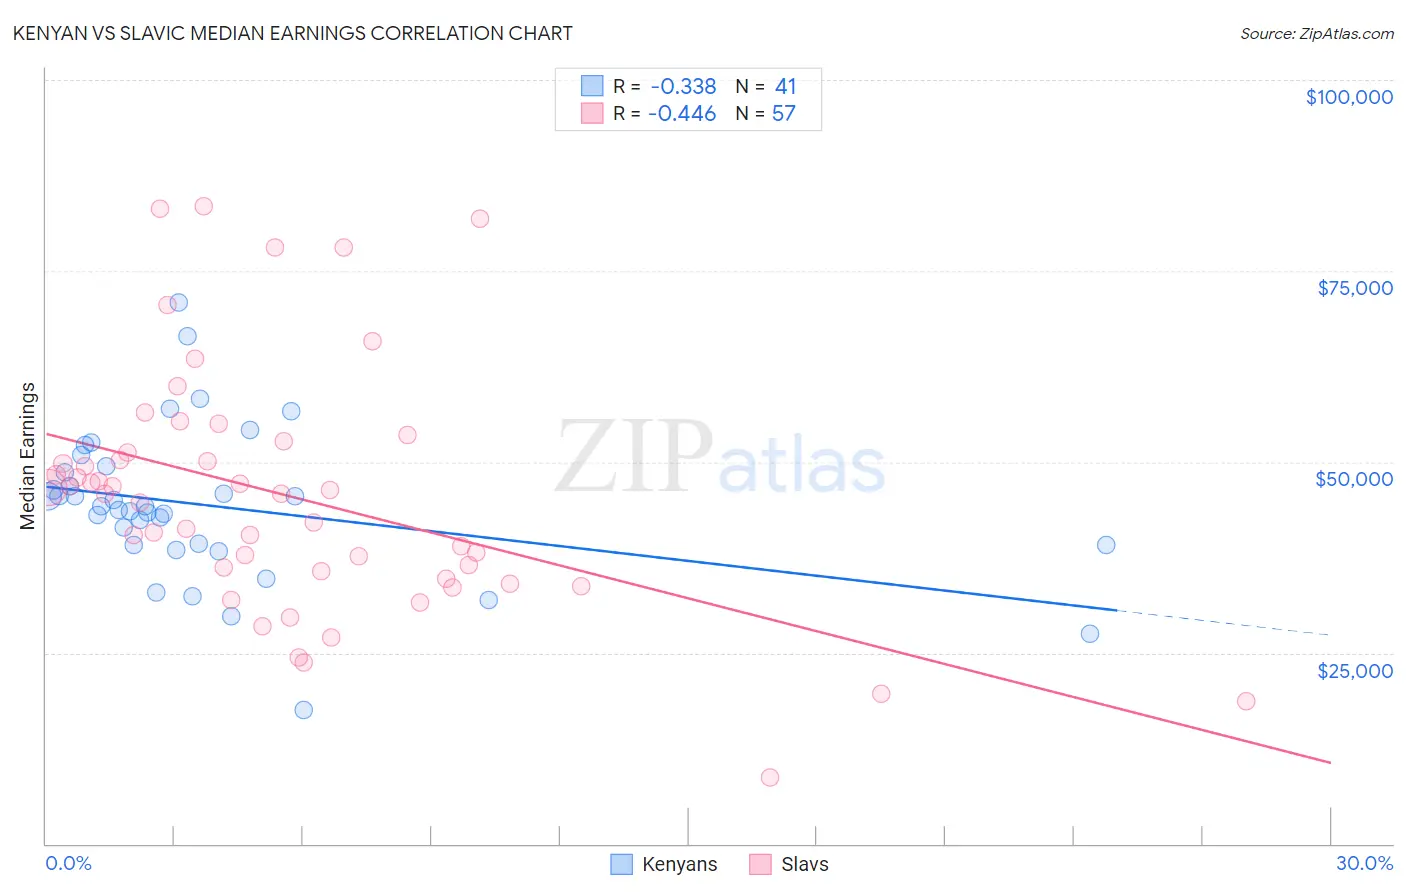
Kenyan vs Slavic Median Earnings Correlation Chart
The statistical analysis conducted on geographies consisting of 168,231,616 people shows a mild negative correlation between the proportion of Kenyans and median earnings in the United States with a correlation coefficient (R) of -0.338 and weighted average of $46,462. Similarly, the statistical analysis conducted on geographies consisting of 270,868,378 people shows a moderate negative correlation between the proportion of Slavs and median earnings in the United States with a correlation coefficient (R) of -0.446 and weighted average of $47,470, a difference of 2.2%.
Median Earnings Correlation Summary
| Measurement | Kenyan | Slavic |
| Minimum | $17,500 | $8,672 |
| Maximum | $70,848 | $83,496 |
| Range | $53,348 | $74,824 |
| Mean | $44,292 | $45,520 |
| Median | $44,246 | $45,848 |
| Interquartile 25% (IQ1) | $39,165 | $35,213 |
| Interquartile 75% (IQ3) | $49,031 | $51,961 |
| Interquartile Range (IQR) | $9,866 | $16,749 |
| Standard Deviation (Sample) | $9,917 | $16,076 |
| Standard Deviation (Population) | $9,795 | $15,935 |
Demographics Similar to Kenyans and Slavs by Median Earnings
In terms of median earnings, the demographic groups most similar to Kenyans are Scottish ($46,463, a difference of 0.0%), Immigrants ($46,478, a difference of 0.030%), Immigrants from South America ($46,548, a difference of 0.18%), Immigrants from Africa ($46,564, a difference of 0.22%), and Costa Rican ($46,645, a difference of 0.39%). Similarly, the demographic groups most similar to Slavs are Immigrants from Germany ($47,566, a difference of 0.20%), Immigrants from Portugal ($47,304, a difference of 0.35%), Immigrants from Vietnam ($47,282, a difference of 0.40%), Irish ($47,276, a difference of 0.41%), and Czech ($47,221, a difference of 0.53%).
| Demographics | Rating | Rank | Median Earnings |
| Immigrants | Germany | 83.1 /100 | #152 | Excellent $47,566 |
| Slavs | 81.1 /100 | #153 | Excellent $47,470 |
| Immigrants | Portugal | 77.3 /100 | #154 | Good $47,304 |
| Immigrants | Vietnam | 76.7 /100 | #155 | Good $47,282 |
| Irish | 76.6 /100 | #156 | Good $47,276 |
| Czechs | 75.1 /100 | #157 | Good $47,221 |
| Slovaks | 71.7 /100 | #158 | Good $47,095 |
| Immigrants | Peru | 69.6 /100 | #159 | Good $47,025 |
| Alsatians | 69.6 /100 | #160 | Good $47,023 |
| Immigrants | Eastern Africa | 68.0 /100 | #161 | Good $46,969 |
| South American Indians | 67.4 /100 | #162 | Good $46,952 |
| Icelanders | 66.3 /100 | #163 | Good $46,916 |
| Norwegians | 64.7 /100 | #164 | Good $46,865 |
| South Americans | 62.7 /100 | #165 | Good $46,804 |
| Czechoslovakians | 57.8 /100 | #166 | Average $46,658 |
| Costa Ricans | 57.4 /100 | #167 | Average $46,645 |
| Immigrants | Africa | 54.6 /100 | #168 | Average $46,564 |
| Immigrants | South America | 54.0 /100 | #169 | Average $46,548 |
| Immigrants | Immigrants | 51.6 /100 | #170 | Average $46,478 |
| Scottish | 51.1 /100 | #171 | Average $46,463 |
| Kenyans | 51.0 /100 | #172 | Average $46,462 |