Pennsylvania German vs Slavic Single Father Households
COMPARE
Pennsylvania German
Slavic
Single Father Households
Single Father Households Comparison
Pennsylvania Germans
Slavs
2.4%
SINGLE FATHER HOUSEHOLDS
7.3/ 100
METRIC RATING
232nd/ 347
METRIC RANK
2.2%
SINGLE FATHER HOUSEHOLDS
88.9/ 100
METRIC RATING
147th/ 347
METRIC RANK
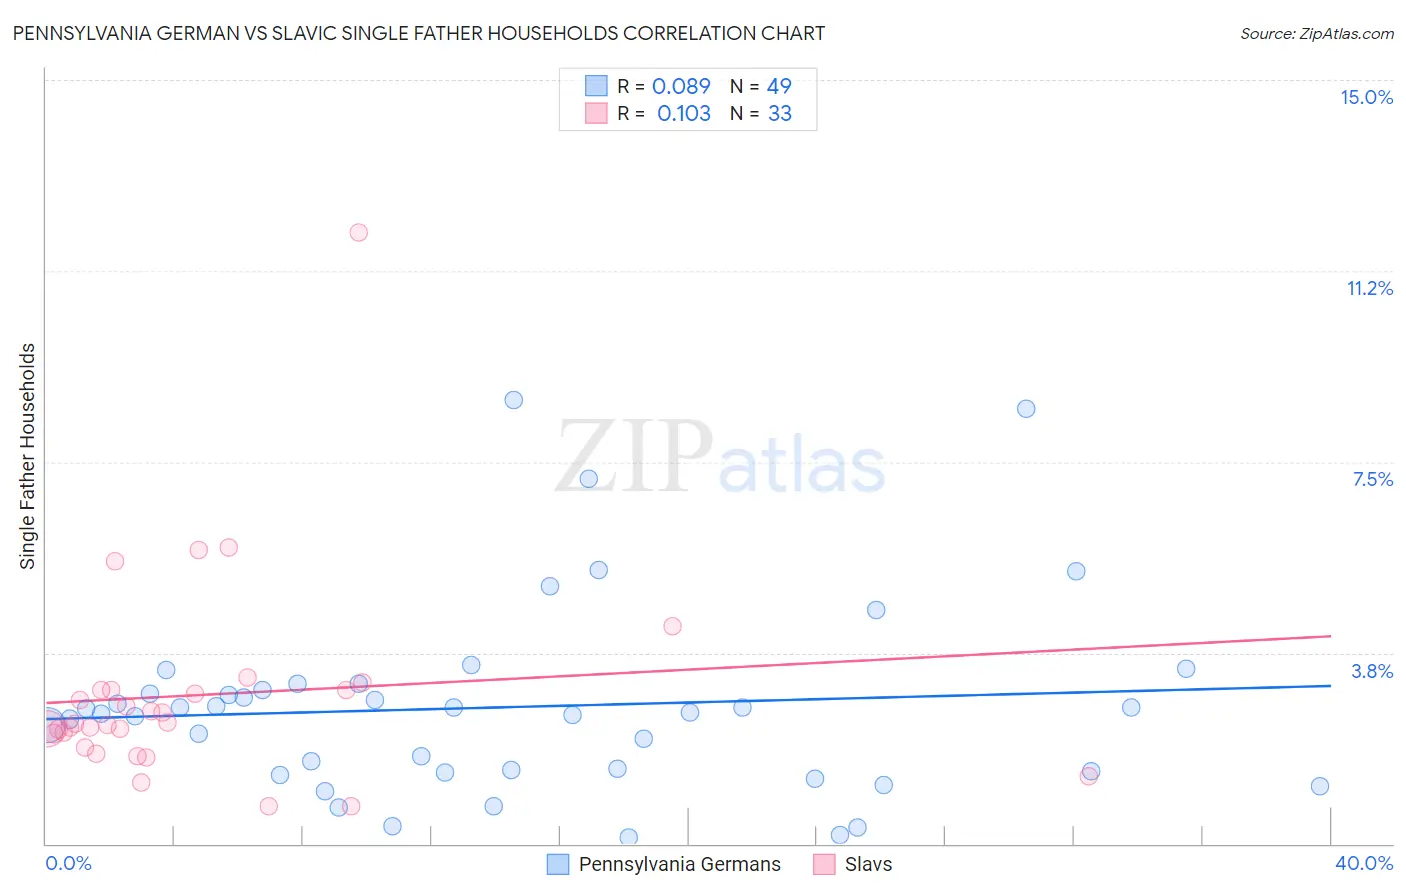
Pennsylvania German vs Slavic Single Father Households Correlation Chart
The statistical analysis conducted on geographies consisting of 232,007,868 people shows a slight positive correlation between the proportion of Pennsylvania Germans and percentage of single father households in the United States with a correlation coefficient (R) of 0.089 and weighted average of 2.4%. Similarly, the statistical analysis conducted on geographies consisting of 269,247,483 people shows a poor positive correlation between the proportion of Slavs and percentage of single father households in the United States with a correlation coefficient (R) of 0.103 and weighted average of 2.2%, a difference of 8.8%.
Single Father Households Correlation Summary
| Measurement | Pennsylvania German | Slavic |
| Minimum | 0.11% | 0.74% |
| Maximum | 8.7% | 12.0% |
| Range | 8.6% | 11.3% |
| Mean | 2.7% | 2.9% |
| Median | 2.6% | 2.4% |
| Interquartile 25% (IQ1) | 1.4% | 2.0% |
| Interquartile 75% (IQ3) | 3.1% | 3.0% |
| Interquartile Range (IQR) | 1.7% | 1.0% |
| Standard Deviation (Sample) | 1.9% | 2.0% |
| Standard Deviation (Population) | 1.9% | 2.0% |
Similar Demographics by Single Father Households
Demographics Similar to Pennsylvania Germans by Single Father Households
In terms of single father households, the demographic groups most similar to Pennsylvania Germans are Immigrants from Western Africa (2.4%, a difference of 0.060%), Nonimmigrants (2.4%, a difference of 0.080%), Subsaharan African (2.4%, a difference of 0.25%), African (2.5%, a difference of 0.26%), and Immigrants (2.5%, a difference of 0.28%).
| Demographics | Rating | Rank | Single Father Households |
| Marshallese | 9.7 /100 | #225 | Tragic 2.4% |
| Blacks/African Americans | 9.7 /100 | #226 | Tragic 2.4% |
| Americans | 9.3 /100 | #227 | Tragic 2.4% |
| Immigrants | Ghana | 9.1 /100 | #228 | Tragic 2.4% |
| Immigrants | Zaire | 8.6 /100 | #229 | Tragic 2.4% |
| Sub-Saharan Africans | 8.3 /100 | #230 | Tragic 2.4% |
| Immigrants | Nonimmigrants | 7.6 /100 | #231 | Tragic 2.4% |
| Pennsylvania Germans | 7.3 /100 | #232 | Tragic 2.4% |
| Immigrants | Western Africa | 7.0 /100 | #233 | Tragic 2.4% |
| Africans | 6.3 /100 | #234 | Tragic 2.5% |
| Immigrants | Immigrants | 6.3 /100 | #235 | Tragic 2.5% |
| Cajuns | 6.1 /100 | #236 | Tragic 2.5% |
| Sierra Leoneans | 5.9 /100 | #237 | Tragic 2.5% |
| Immigrants | Sierra Leone | 5.8 /100 | #238 | Tragic 2.5% |
| Immigrants | Oceania | 5.8 /100 | #239 | Tragic 2.5% |
Demographics Similar to Slavs by Single Father Households
In terms of single father households, the demographic groups most similar to Slavs are South American Indian (2.3%, a difference of 0.090%), Senegalese (2.3%, a difference of 0.10%), Northern European (2.2%, a difference of 0.18%), Immigrants from Zimbabwe (2.2%, a difference of 0.26%), and Slovak (2.2%, a difference of 0.37%).
| Demographics | Rating | Rank | Single Father Households |
| British | 92.8 /100 | #140 | Exceptional 2.2% |
| Laotians | 92.5 /100 | #141 | Exceptional 2.2% |
| Luxembourgers | 92.3 /100 | #142 | Exceptional 2.2% |
| Immigrants | Nepal | 92.1 /100 | #143 | Exceptional 2.2% |
| Slovaks | 90.7 /100 | #144 | Exceptional 2.2% |
| Immigrants | Zimbabwe | 90.2 /100 | #145 | Exceptional 2.2% |
| Northern Europeans | 89.8 /100 | #146 | Excellent 2.2% |
| Slavs | 88.9 /100 | #147 | Excellent 2.2% |
| South American Indians | 88.5 /100 | #148 | Excellent 2.3% |
| Senegalese | 88.4 /100 | #149 | Excellent 2.3% |
| Venezuelans | 86.2 /100 | #150 | Excellent 2.3% |
| Immigrants | Syria | 84.8 /100 | #151 | Excellent 2.3% |
| Immigrants | Venezuela | 83.2 /100 | #152 | Excellent 2.3% |
| Immigrants | Germany | 82.8 /100 | #153 | Excellent 2.3% |
| Bolivians | 81.0 /100 | #154 | Excellent 2.3% |