Kenyan vs Slavic Single Mother Poverty
COMPARE
Kenyan
Slavic
Single Mother Poverty
Single Mother Poverty Comparison
Kenyans
Slavs
28.4%
SINGLE MOTHER POVERTY
90.9/ 100
METRIC RATING
125th/ 347
METRIC RANK
29.6%
SINGLE MOTHER POVERTY
24.5/ 100
METRIC RATING
195th/ 347
METRIC RANK
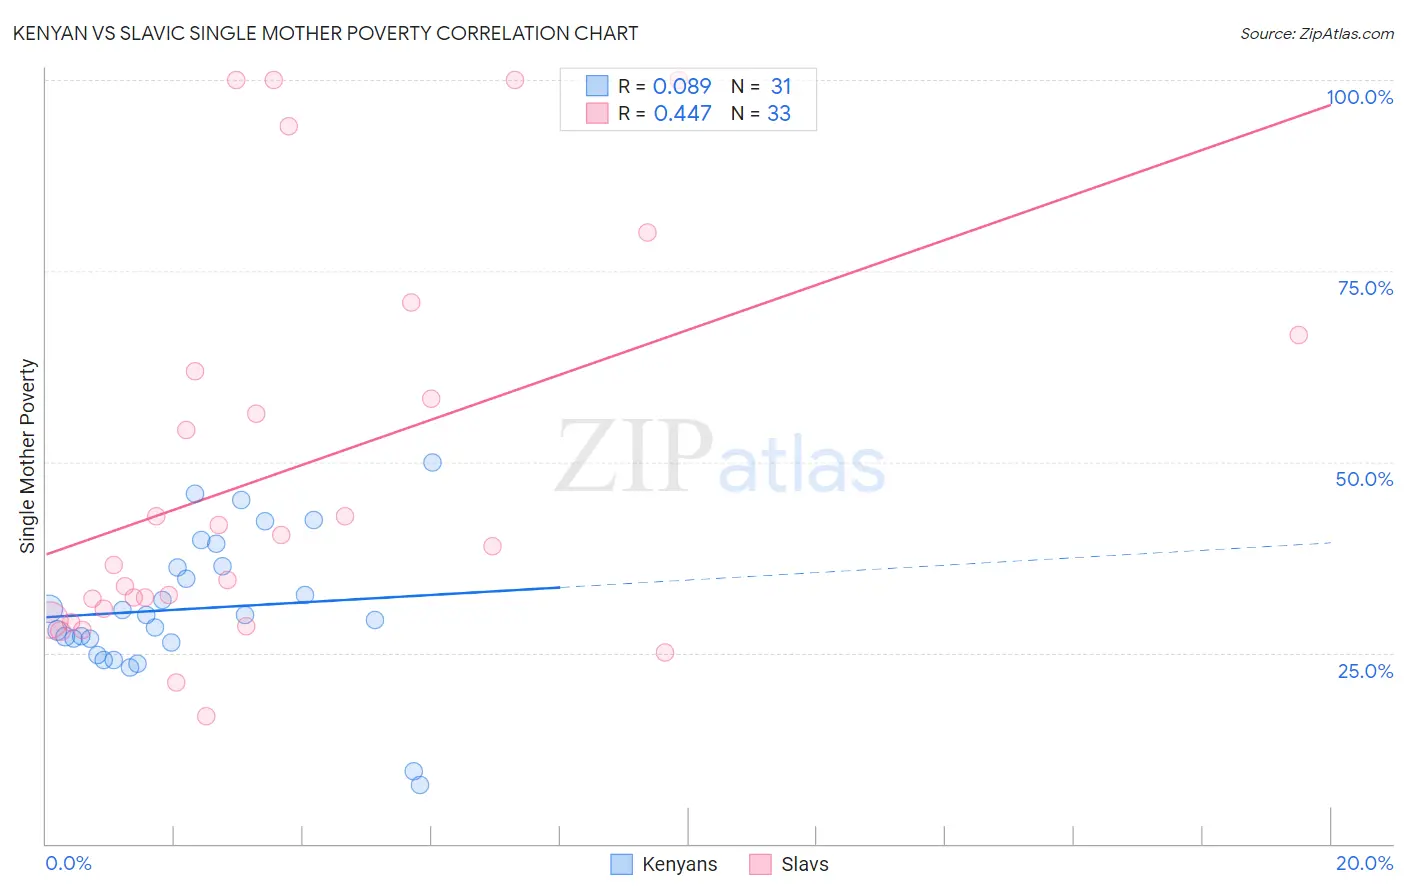
Kenyan vs Slavic Single Mother Poverty Correlation Chart
The statistical analysis conducted on geographies consisting of 166,617,669 people shows a slight positive correlation between the proportion of Kenyans and poverty level among single mothers in the United States with a correlation coefficient (R) of 0.089 and weighted average of 28.4%. Similarly, the statistical analysis conducted on geographies consisting of 265,304,000 people shows a moderate positive correlation between the proportion of Slavs and poverty level among single mothers in the United States with a correlation coefficient (R) of 0.447 and weighted average of 29.6%, a difference of 4.2%.
Single Mother Poverty Correlation Summary
| Measurement | Kenyan | Slavic |
| Minimum | 7.7% | 16.7% |
| Maximum | 50.0% | 100.0% |
| Range | 42.3% | 83.3% |
| Mean | 30.8% | 49.1% |
| Median | 29.9% | 38.9% |
| Interquartile 25% (IQ1) | 26.3% | 30.0% |
| Interquartile 75% (IQ3) | 36.3% | 64.3% |
| Interquartile Range (IQR) | 10.0% | 34.3% |
| Standard Deviation (Sample) | 9.3% | 25.8% |
| Standard Deviation (Population) | 9.2% | 25.4% |
Similar Demographics by Single Mother Poverty
Demographics Similar to Kenyans by Single Mother Poverty
In terms of single mother poverty, the demographic groups most similar to Kenyans are Immigrants from Chile (28.4%, a difference of 0.010%), Polish (28.4%, a difference of 0.020%), Immigrants from England (28.4%, a difference of 0.050%), South American (28.4%, a difference of 0.070%), and Norwegian (28.4%, a difference of 0.080%).
| Demographics | Rating | Rank | Single Mother Poverty |
| Brazilians | 92.4 /100 | #118 | Exceptional 28.3% |
| Immigrants | Syria | 92.4 /100 | #119 | Exceptional 28.3% |
| Cypriots | 92.3 /100 | #120 | Exceptional 28.3% |
| Immigrants | Afghanistan | 92.1 /100 | #121 | Exceptional 28.3% |
| Colombians | 91.8 /100 | #122 | Exceptional 28.3% |
| Uruguayans | 91.7 /100 | #123 | Exceptional 28.3% |
| Immigrants | Switzerland | 91.7 /100 | #124 | Exceptional 28.3% |
| Kenyans | 90.9 /100 | #125 | Exceptional 28.4% |
| Immigrants | Chile | 90.8 /100 | #126 | Exceptional 28.4% |
| Poles | 90.8 /100 | #127 | Exceptional 28.4% |
| Immigrants | England | 90.5 /100 | #128 | Exceptional 28.4% |
| South Americans | 90.4 /100 | #129 | Exceptional 28.4% |
| Norwegians | 90.4 /100 | #130 | Exceptional 28.4% |
| Immigrants | Austria | 90.3 /100 | #131 | Exceptional 28.4% |
| Immigrants | Morocco | 89.5 /100 | #132 | Excellent 28.4% |
Demographics Similar to Slavs by Single Mother Poverty
In terms of single mother poverty, the demographic groups most similar to Slavs are Spanish American Indian (29.6%, a difference of 0.070%), Icelander (29.5%, a difference of 0.10%), Immigrants from Jamaica (29.6%, a difference of 0.17%), Trinidadian and Tobagonian (29.6%, a difference of 0.18%), and Basque (29.5%, a difference of 0.23%).
| Demographics | Rating | Rank | Single Mother Poverty |
| Guamanians/Chamorros | 31.8 /100 | #188 | Fair 29.4% |
| Immigrants | Africa | 31.6 /100 | #189 | Fair 29.4% |
| Immigrants | Germany | 30.4 /100 | #190 | Fair 29.5% |
| Immigrants | Trinidad and Tobago | 29.2 /100 | #191 | Fair 29.5% |
| Moroccans | 28.6 /100 | #192 | Fair 29.5% |
| Basques | 28.3 /100 | #193 | Fair 29.5% |
| Icelanders | 26.1 /100 | #194 | Fair 29.5% |
| Slavs | 24.5 /100 | #195 | Fair 29.6% |
| Spanish American Indians | 23.4 /100 | #196 | Fair 29.6% |
| Immigrants | Jamaica | 22.0 /100 | #197 | Fair 29.6% |
| Trinidadians and Tobagonians | 21.7 /100 | #198 | Fair 29.6% |
| Cubans | 20.8 /100 | #199 | Fair 29.6% |
| Panamanians | 20.0 /100 | #200 | Fair 29.6% |
| Belgians | 18.8 /100 | #201 | Poor 29.7% |
| Malaysians | 17.4 /100 | #202 | Poor 29.7% |