Jordanian vs Immigrants from Norway Family Households
COMPARE
Jordanian
Immigrants from Norway
Family Households
Family Households Comparison
Jordanians
Immigrants from Norway
65.5%
FAMILY HOUSEHOLDS
99.7/ 100
METRIC RATING
81st/ 347
METRIC RANK
62.1%
FAMILY HOUSEHOLDS
0.0/ 100
METRIC RATING
307th/ 347
METRIC RANK
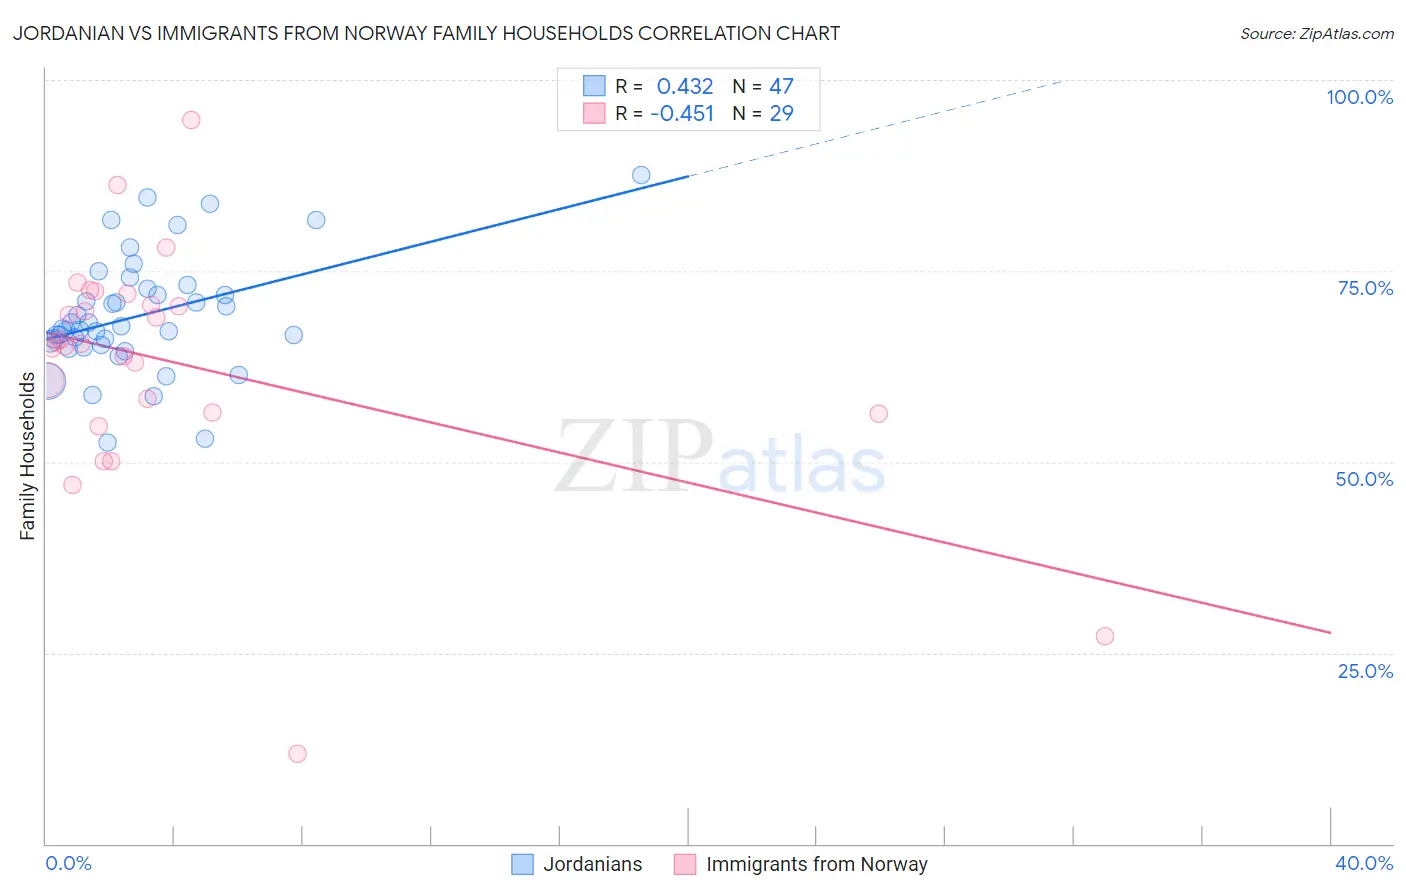
Jordanian vs Immigrants from Norway Family Households Correlation Chart
The statistical analysis conducted on geographies consisting of 166,395,405 people shows a moderate positive correlation between the proportion of Jordanians and percentage of family households in the United States with a correlation coefficient (R) of 0.432 and weighted average of 65.5%. Similarly, the statistical analysis conducted on geographies consisting of 116,686,104 people shows a moderate negative correlation between the proportion of Immigrants from Norway and percentage of family households in the United States with a correlation coefficient (R) of -0.451 and weighted average of 62.1%, a difference of 5.6%.
Family Households Correlation Summary
| Measurement | Jordanian | Immigrants from Norway |
| Minimum | 52.5% | 11.8% |
| Maximum | 87.5% | 94.8% |
| Range | 35.0% | 83.1% |
| Mean | 69.1% | 62.9% |
| Median | 67.5% | 65.4% |
| Interquartile 25% (IQ1) | 65.3% | 56.4% |
| Interquartile 75% (IQ3) | 72.6% | 71.3% |
| Interquartile Range (IQR) | 7.3% | 14.9% |
| Standard Deviation (Sample) | 7.5% | 15.9% |
| Standard Deviation (Population) | 7.5% | 15.6% |
Similar Demographics by Family Households
Demographics Similar to Jordanians by Family Households
In terms of family households, the demographic groups most similar to Jordanians are Immigrants from Lebanon (65.5%, a difference of 0.040%), Immigrants from Guyana (65.5%, a difference of 0.040%), American (65.5%, a difference of 0.060%), Puget Sound Salish (65.6%, a difference of 0.080%), and Immigrants from Costa Rica (65.6%, a difference of 0.10%).
| Demographics | Rating | Rank | Family Households |
| Burmese | 99.9 /100 | #74 | Exceptional 65.7% |
| Houma | 99.9 /100 | #75 | Exceptional 65.7% |
| Immigrants | Azores | 99.8 /100 | #76 | Exceptional 65.6% |
| Immigrants | South America | 99.8 /100 | #77 | Exceptional 65.6% |
| Yaqui | 99.8 /100 | #78 | Exceptional 65.6% |
| Immigrants | Costa Rica | 99.8 /100 | #79 | Exceptional 65.6% |
| Puget Sound Salish | 99.8 /100 | #80 | Exceptional 65.6% |
| Jordanians | 99.7 /100 | #81 | Exceptional 65.5% |
| Immigrants | Lebanon | 99.7 /100 | #82 | Exceptional 65.5% |
| Immigrants | Guyana | 99.6 /100 | #83 | Exceptional 65.5% |
| Americans | 99.6 /100 | #84 | Exceptional 65.5% |
| Immigrants | Cambodia | 99.5 /100 | #85 | Exceptional 65.4% |
| Egyptians | 99.4 /100 | #86 | Exceptional 65.4% |
| Immigrants | Egypt | 99.2 /100 | #87 | Exceptional 65.3% |
| Immigrants | Haiti | 99.1 /100 | #88 | Exceptional 65.3% |
Demographics Similar to Immigrants from Norway by Family Households
In terms of family households, the demographic groups most similar to Immigrants from Norway are Chippewa (62.1%, a difference of 0.0%), Subsaharan African (62.1%, a difference of 0.050%), African (62.1%, a difference of 0.080%), Bermudan (62.2%, a difference of 0.10%), and Immigrants from Liberia (62.0%, a difference of 0.10%).
| Demographics | Rating | Rank | Family Households |
| Immigrants | Africa | 0.0 /100 | #300 | Tragic 62.4% |
| Immigrants | Albania | 0.0 /100 | #301 | Tragic 62.4% |
| Immigrants | Kenya | 0.0 /100 | #302 | Tragic 62.3% |
| Cree | 0.0 /100 | #303 | Tragic 62.3% |
| Iroquois | 0.0 /100 | #304 | Tragic 62.2% |
| Bermudans | 0.0 /100 | #305 | Tragic 62.2% |
| Africans | 0.0 /100 | #306 | Tragic 62.1% |
| Immigrants | Norway | 0.0 /100 | #307 | Tragic 62.1% |
| Chippewa | 0.0 /100 | #308 | Tragic 62.1% |
| Sub-Saharan Africans | 0.0 /100 | #309 | Tragic 62.1% |
| Immigrants | Liberia | 0.0 /100 | #310 | Tragic 62.0% |
| Immigrants | Morocco | 0.0 /100 | #311 | Tragic 62.0% |
| Immigrants | Latvia | 0.0 /100 | #312 | Tragic 62.0% |
| Liberians | 0.0 /100 | #313 | Tragic 62.0% |
| Immigrants | Cabo Verde | 0.0 /100 | #314 | Tragic 61.9% |