Immigrants from Scotland vs Black/African American Divorced or Separated
COMPARE
Immigrants from Scotland
Black/African American
Divorced or Separated
Divorced or Separated Comparison
Immigrants from Scotland
Blacks/African Americans
12.0%
DIVORCED OR SEPARATED
65.8/ 100
METRIC RATING
160th/ 347
METRIC RANK
13.6%
DIVORCED OR SEPARATED
0.0/ 100
METRIC RATING
331st/ 347
METRIC RANK
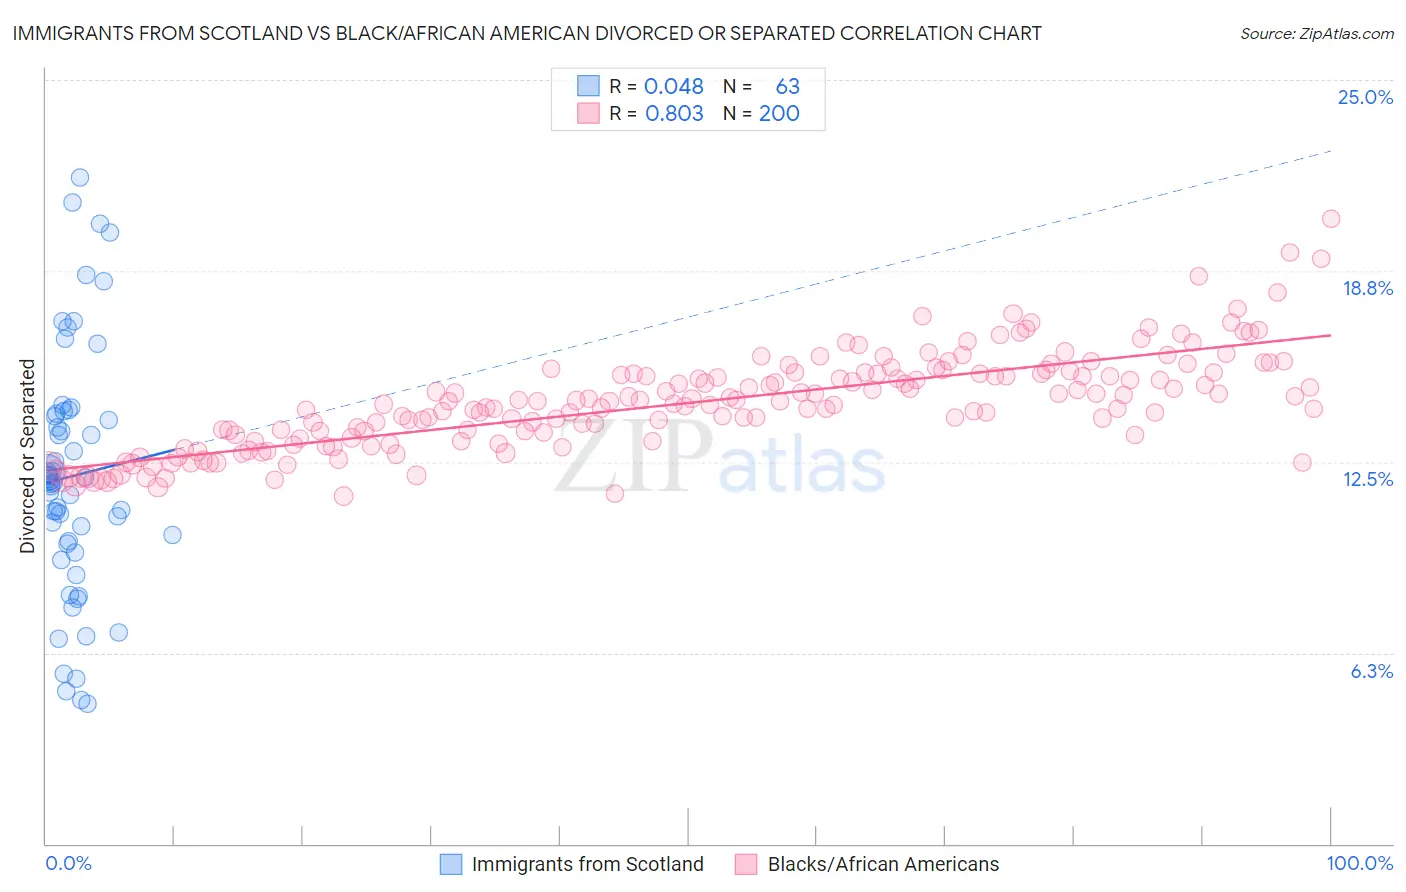
Immigrants from Scotland vs Black/African American Divorced or Separated Correlation Chart
The statistical analysis conducted on geographies consisting of 196,385,271 people shows no correlation between the proportion of Immigrants from Scotland and percentage of population currently divorced or separated in the United States with a correlation coefficient (R) of 0.048 and weighted average of 12.0%. Similarly, the statistical analysis conducted on geographies consisting of 565,552,203 people shows a very strong positive correlation between the proportion of Blacks/African Americans and percentage of population currently divorced or separated in the United States with a correlation coefficient (R) of 0.803 and weighted average of 13.6%, a difference of 13.7%.
Divorced or Separated Correlation Summary
| Measurement | Immigrants from Scotland | Black/African American |
| Minimum | 4.6% | 11.4% |
| Maximum | 21.8% | 20.4% |
| Range | 17.2% | 9.1% |
| Mean | 12.0% | 14.4% |
| Median | 11.9% | 14.4% |
| Interquartile 25% (IQ1) | 9.8% | 13.2% |
| Interquartile 75% (IQ3) | 14.1% | 15.4% |
| Interquartile Range (IQR) | 4.2% | 2.2% |
| Standard Deviation (Sample) | 4.0% | 1.6% |
| Standard Deviation (Population) | 4.0% | 1.6% |
Similar Demographics by Divorced or Separated
Demographics Similar to Immigrants from Scotland by Divorced or Separated
In terms of divorced or separated, the demographic groups most similar to Immigrants from Scotland are Icelander (12.0%, a difference of 0.010%), Immigrants from Barbados (12.0%, a difference of 0.010%), Marshallese (12.0%, a difference of 0.040%), Samoan (12.0%, a difference of 0.060%), and Navajo (12.0%, a difference of 0.070%).
| Demographics | Rating | Rank | Divorced or Separated |
| Austrians | 72.2 /100 | #153 | Good 12.0% |
| Chileans | 71.3 /100 | #154 | Good 12.0% |
| Japanese | 70.9 /100 | #155 | Good 12.0% |
| Hungarians | 70.3 /100 | #156 | Good 12.0% |
| Immigrants | Brazil | 68.8 /100 | #157 | Good 12.0% |
| Icelanders | 66.0 /100 | #158 | Good 12.0% |
| Immigrants | Barbados | 66.0 /100 | #159 | Good 12.0% |
| Immigrants | Scotland | 65.8 /100 | #160 | Good 12.0% |
| Marshallese | 64.6 /100 | #161 | Good 12.0% |
| Samoans | 64.3 /100 | #162 | Good 12.0% |
| Navajo | 63.9 /100 | #163 | Good 12.0% |
| Swiss | 63.6 /100 | #164 | Good 12.0% |
| German Russians | 61.8 /100 | #165 | Good 12.0% |
| Tohono O'odham | 60.4 /100 | #166 | Good 12.0% |
| Ethiopians | 58.5 /100 | #167 | Average 12.0% |
Demographics Similar to Blacks/African Americans by Divorced or Separated
In terms of divorced or separated, the demographic groups most similar to Blacks/African Americans are Paiute (13.6%, a difference of 0.13%), Houma (13.6%, a difference of 0.24%), Immigrants from Caribbean (13.6%, a difference of 0.39%), Cherokee (13.7%, a difference of 0.76%), and Comanche (13.5%, a difference of 0.77%).
| Demographics | Rating | Rank | Divorced or Separated |
| Osage | 0.0 /100 | #324 | Tragic 13.4% |
| Potawatomi | 0.0 /100 | #325 | Tragic 13.5% |
| Immigrants | Congo | 0.0 /100 | #326 | Tragic 13.5% |
| Comanche | 0.0 /100 | #327 | Tragic 13.5% |
| Immigrants | Caribbean | 0.0 /100 | #328 | Tragic 13.6% |
| Houma | 0.0 /100 | #329 | Tragic 13.6% |
| Paiute | 0.0 /100 | #330 | Tragic 13.6% |
| Blacks/African Americans | 0.0 /100 | #331 | Tragic 13.6% |
| Cherokee | 0.0 /100 | #332 | Tragic 13.7% |
| Puerto Ricans | 0.0 /100 | #333 | Tragic 13.9% |
| Immigrants | Bahamas | 0.0 /100 | #334 | Tragic 13.9% |
| Dutch West Indians | 0.0 /100 | #335 | Tragic 14.0% |
| Shoshone | 0.0 /100 | #336 | Tragic 14.0% |
| Crow | 0.0 /100 | #337 | Tragic 14.1% |
| Choctaw | 0.0 /100 | #338 | Tragic 14.1% |